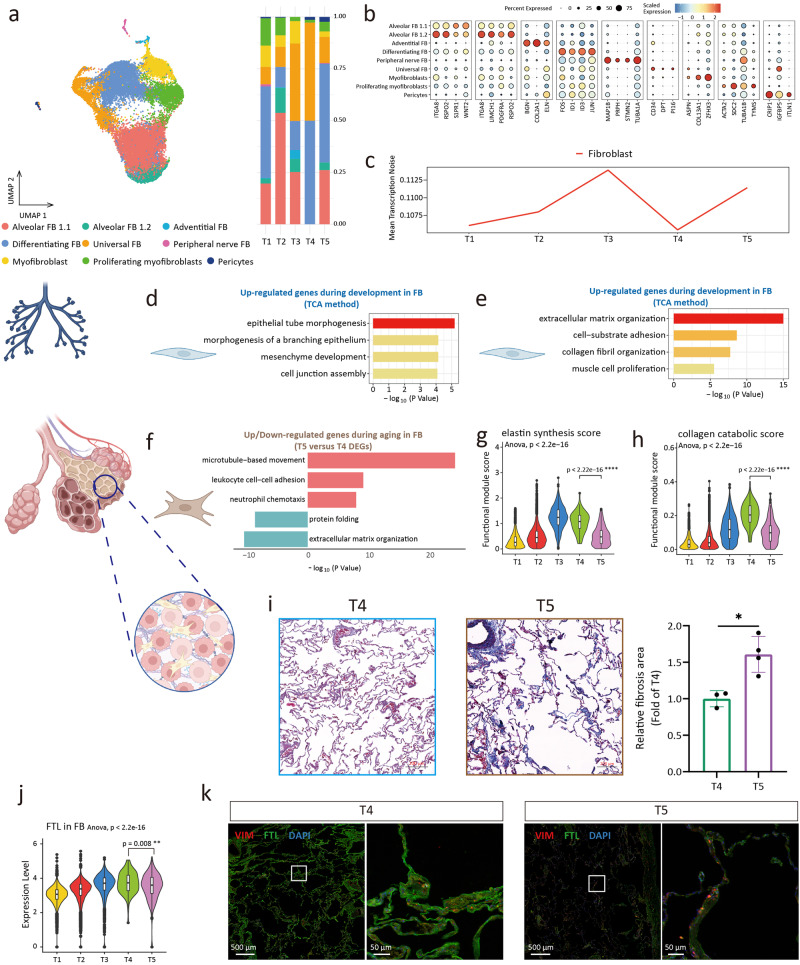
Fig. 4. Dynamic changes of fibroblast during development and aging.
a UMAP plots of fibroblast (FB) (left). Proportion of fibroblast subclusters in 5 groups (right). b Dot plots of specific marker genes of fibroblast. c The age-associated changes of transcriptional noise of fibroblast. d Gene ontology enrichment analysis of gene expression in cluster 2 of fibroblast (development). e Gene ontology enrichment analysis of gene expression in cluster 6 of fibroblast (development). f Gene ontology enrichment analysis of up (top part, red)/down (bottom part, blue)-regulated gene expression in fibroblast. g Elastin synthesis (GO: 0071953) score of fibroblasts between 5 groups. h Collagen catabolic (GO: 0030574) score of fibroblasts between 5 groups. i Masson-stained sections of lung tissues between 5 groups and relative fibrosis area of the lung tissues shown as the means ± SD, tested by two-tailed t-test. *p < 0.05. j Relatively expression of FTL in fibroblast in single-cell analysis. k The expression of FTL in fibroblast of immunofluorecence staining. The choice of ANOVA tests was based on the results of Shapiro–Wilk normality test. Dunnett tests were used to inter-group comparison. **p < 0.01, ****p < 0.0001.

