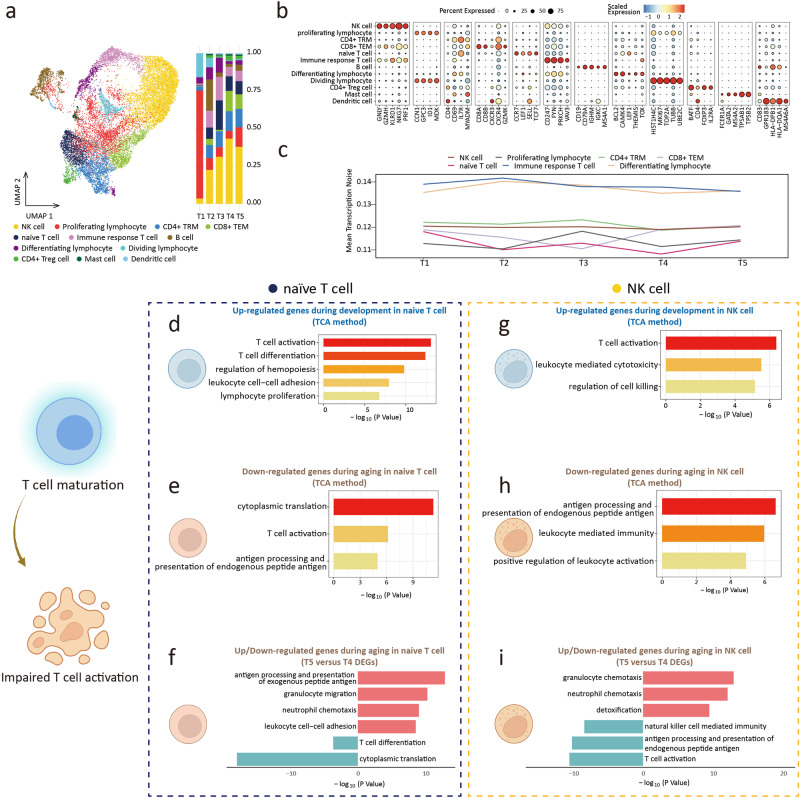
Fig. 6. Lymphoid cell.
a UMAP plots of Lymphoid cell (Lym) (left). Proportion of Lymphoid cell subclusters in 5 groups (right). b Dot plots of specific marker genes of Lym. c The age-associated changes of transcriptional noise of Lym subclusters. d Gene ontology enrichment analysis of gene expression in cluster 6 of naïve T cell (development). e Gene ontology enrichment analysis of gene expression in cluster 3 of naïve T cell (aging). f Gene ontology enrichment analysis of up (top part, red)/down (bottom part, blue)-regulated gene expression in aging naïve T cell. g Gene ontology enrichment analysis of gene expression in cluster 2 of NK cell (development). h Gene ontology enrichment analysis of gene expression in cluster 6 of NK cell (aging). i Gene ontology enrichment analysis of up (top part, red)/down (bottom part, blue)-regulated gene expression in aging NK cell.

