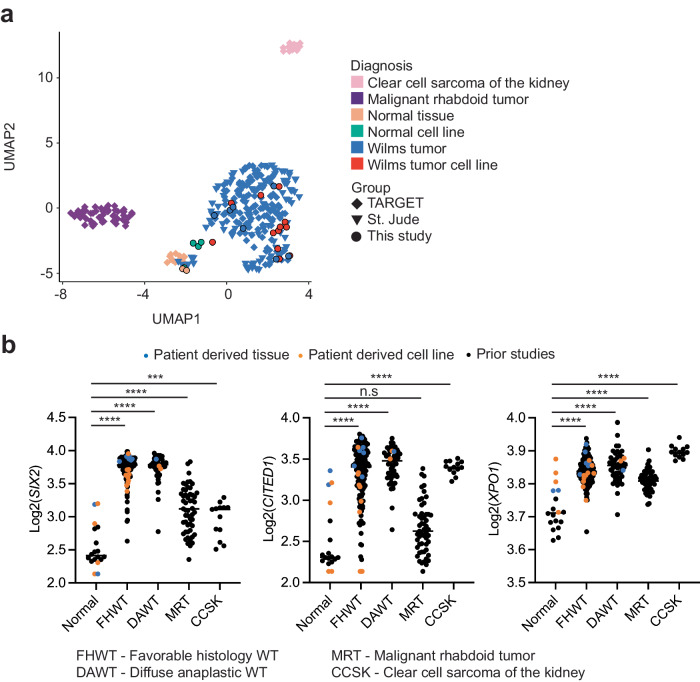
Fig. 2. Overview of the transcriptomic analysis of Wilms tumor samples.
a Two-dimensional representation of RNA-seq data using uniform manifold approximation and projection (UMAP) demonstrates high concordance between TARGET (diamond, n = 205) and St. Jude primary WT (triangles, n = 80) and samples in this study (circles, n = 25). Normal tissue samples, clear cell sarcoma of the kidney, and malignant rhabdoid tumor all clustered separately. b Dot plots of normalized read counts representing the higher expression of commonly dysregulated genes (SIX2, CITED1, and XPO1) in WT in the TARGET (n = 205) and St. Jude (n = 53) datasets and this study (n = 25) with known sub-diagnosis. Blue and orange dots are samples included in this study. Black bars indicate the mean of each group.

