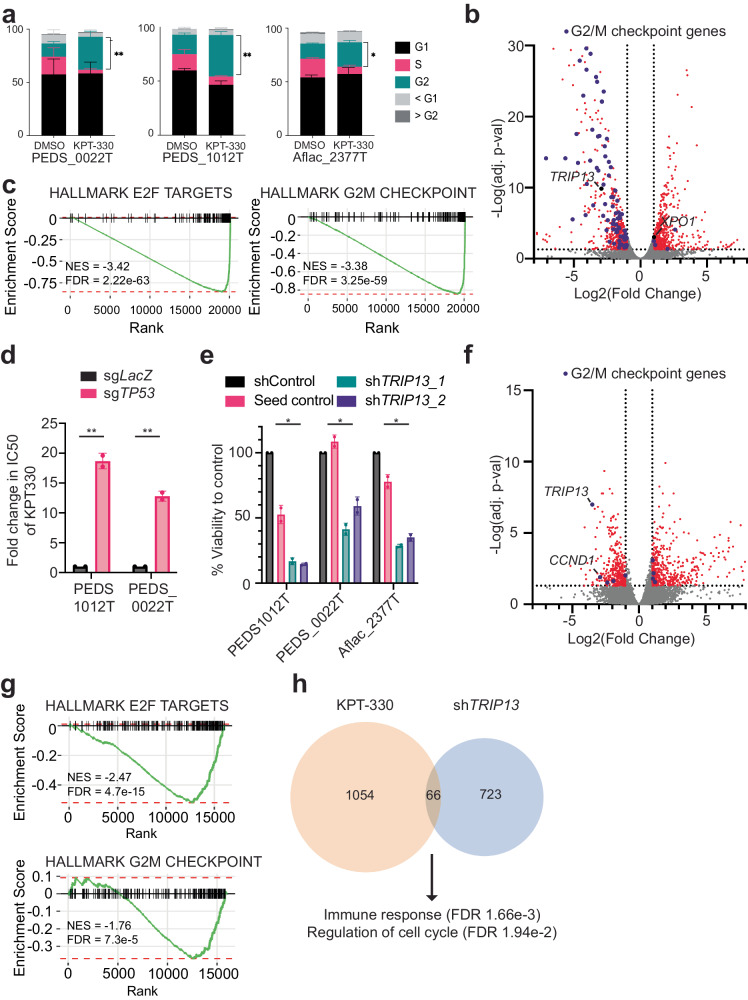
Fig. 4. XPO1 inhibition leads to decreased viability through TRIP13 and p53 axis.
a KPT-330 and DMSO treated PEDS_0022T, PEDS1012T, and Aflac_2377 cells were subjected to cell cycle analysis following flow cytometry. Stacked bar graph representing the proportion of cells across phases of the cell cycle in at least biological replicates and 50k cells counted. Error bars represent mean ± SD. *P value < 0.05, **P value < 0.005 from a Student’s two-tailed unpaired t test. b Volcano plot representing differential gene expression between the KPT-330 and DMSO treated PEDS_0041_T1 cell line. Scattered points represent genes: the x axis is the fold change for KPT-330 vs. DMSO treated PEDS_0041_T1 cells and the y axis is the P values. Purple dots represent genes in the Hallmark G2/M Checkpoint gene set. c Gene set enrichment analysis (GSEA) enrichment score curves for the E2F and G2M hallmark pathways in the PEDS_0041_T1 cells treated with KPT-330. The green curve denotes the NES (normalized enrichment score) curve, the running sum of the weighted enrichment score in GSEA. d Deletion of TP53 significantly increased the IC50 of KPT-330 in PEDS1012T and PEDS_0022T. The fold change is based on comparison to a LacZ non-targeting control and based on biological duplicates. Error bars represent mean ± SD, **P value < 0.005 from a Student’s unpaired two-sided t test. e Change in viability using shTRIP13_1 and shTRIP13_2 across FHWT cell lines as compared to shControl and seed control (to shTRIP13_2). Error bars represent mean ± SD. *P value <0.05 from a Student’s unpaired two-sided t test. f Volcano plot showing the distribution of significant genes up or downregulated following shTRIP13. RNA-seq was performed on Aflac_2377T and PEDS_0041_T1 cell lines with shTRIP13 as compared to shControl. Biological replicates performed. The x axis is the fold change for shTRIP13 vs. shControl cells and the y axis is the adjusted P values. TRIP13 is downregulated along with CCND1. g Gene set enrichment analysis (GSEA) enrichment score curves for the E2F and G2M hallmark pathways following suppression with shTRIP13. h Number of commonly upregulated and downregulated genes seen in both KPT-330 treated or shTRIP13 treated cells. Pathways and significance of overlapping genes obtained from over-representation test.

