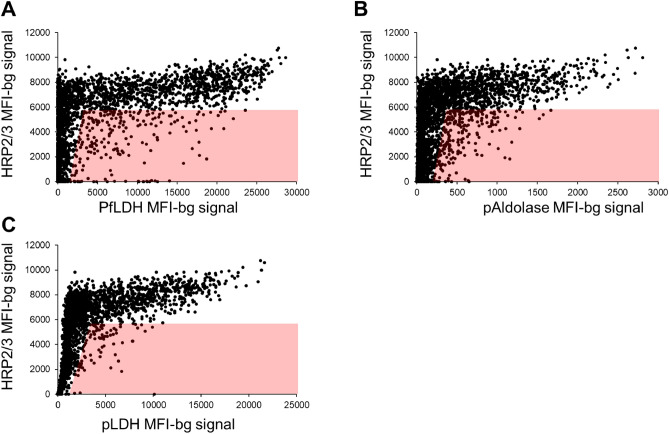
Figure 2.
Scatterplots of HRP2 (and HRP3, HRP2/3) antigen levels as compared with other Plasmodium antigens. Scatterplots represent data from all 7847 DBS which were assayed by bead-based multiplex assay for Plasmodium antigens. Antigen levels for HRP2/3 versus PfLDH (A), pAldolase (B), and pLDH (C). Red shading indicates DBS with depressed or absent HRP2/3 levels selected for subsequent pfhrp2 and pfhrp3 genotyping based on discordant antigen signal between HRP2 (HRP3) and the pan-Plasmodium antigens aldolase or LDH or the falciparum-specific LDH. It is not only discordance in terms of negative signal to HRP2 and positive to any of the others, but also if the level of HRP2 is lower than the level of the aldolase/LDH antigens, as described in the methods.

