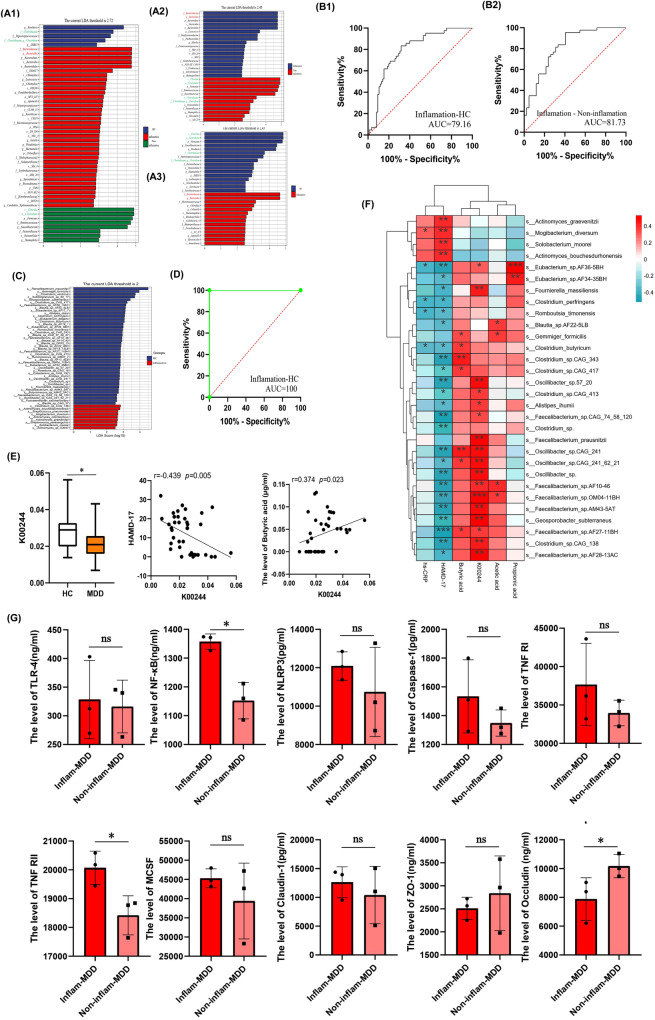
Fig. 3. Gut microbiota characteristics, intestinal mucosal inflammatory factors and permeability biomakers of inflammatory depression.
A To clarify the characteristics of gut microbiota in inflammatory depression, The LEfSe analysis was performed among three groups and found that compared with Non-inflammatory depression and HCs, the relative abundance of Bacteroidaceae and Bacteroides were significantly higher, Clostridiaceae and Clostridium were lower in Inflammatory depression patientsl. B To determine the biomarkers for discriminating between inflammatory depression and HC, between inflammatory depression and Non-inflammatory depression at the genus level, the receiver operating characteristic (ROC) curve were made to by combining all different genus. The ROC analysis showed that the AUC was 81.73% and 79.16% separately. C To further identify the specific microbiota at species level and guide treatment, the shotgun metagenomic sequencing was used for gut microbiota of inflammatory depression (n = 20) and HCs (n = 20). We performed LEfSe analysis and found at the species level, the relative abundance of 43 species was significantly lower in the inflammatory depression group, and 9 bacterial species were enriched in Inflammatory depression. D To make accurate diagnostic models for inflammatory depression, ROC curve were made to by combining all different species and found the AUC was 100%. E The different Kyoto Encyclopedia of Genes and Genomes (KEGG) orthology (KO) analysis found the expression of K00244 (fumarate reductase A, an enzyme involved in the butanoate metabolism) was significantly decreased in Inflammatory depression group (n = 20). Two-sample T test was used. Data are presented as mean values with SD. Box plots indicate median and interquartile range. The upper and lower whiskers indicate minima and maxima. The correlation analysis found the K00244 abundance was significant negative correlated with the HAMD-17 scores (r = −0.439, P = 0.005), and positive correlated with the level of butyric acid (r = 0.374, P = 0.023). Pearson correlation analyses were implemented. F The correlation analysis showed that the relative abundance of abnormal gut microbiota were associated with hs-CRP, SCFAs, K00244, HAMD-17. Red and blue color represent positive correlation and negative correlation, respectively. Pearson correlation analyses were implemented with FDR correction. P-value is marked as follows: ***P ≤ 0.001; **P ≤ 0.01; *P ≤ 0.05. G The inflammatory factors and permeability biomakers of intestinal mucosa in inflammatory depression(n = 3). Compared with Non-inflammatory depression group (n = 3), the inflammatory factor TLR-4 (P = 0.812), NF-κB (P = 0.018), NLRP3 (P = 0.392), Caspase-1 (P = 0.302), TNF-RI (P = 0.318), TNF-RII (P = 0.033), MCSF (P = 0.371), were increased and the permeability biomakers such as ZO-1 (P = 0.537), Occludin (P = 0.048) were decreased in intestinal mucosa of inflammatory depression. Two-sample T test was used. Data are presented as mean values with SD. Scatter plot indicate median and error range. The upper and lower whiskers indicate median± SD. P-value is marked as follows: *P ≤ 0.05. ns indicates non-significant. All statistical tests are two-sided. Source data are provided as a Source Data File.

