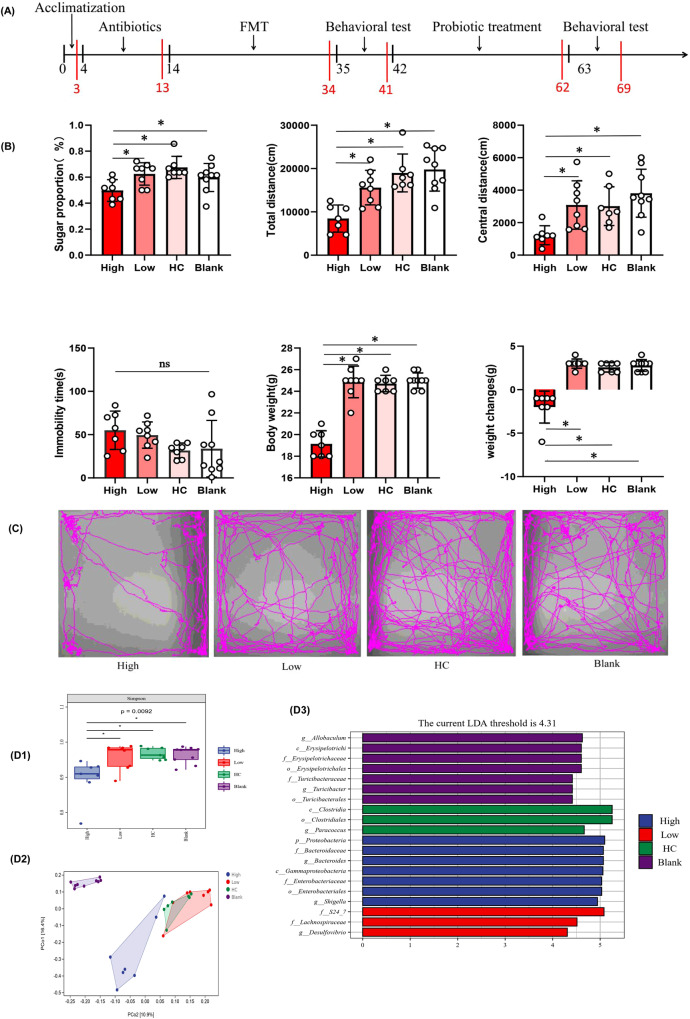
Fig. 4. Behavioral characteristics and gut microbiota composition in mouse model of inflammatory depression.
A The Schematic diagram of mouse treatment and behavioral testing. Mice were given a cocktail of antibiotics to eliminate gut microbiota and were recolonized with the fecal microbiota of Inflammatory depression patients (High-inflammatory group), Non-inflammatory depression patients (Low-inflammatory group), HCs (HC group) and normal saline (NS) (Blank group) respectively. Then High-inflammatory group mice were given the probiotics clostridium butyricum (CB) for 21 days. A series of behavioral tests were carried out 24 h after the last fecal microbiota transplantation or probiotic intervention. B Behavioral comparisons among recipient mice receiving the gut microbiota suspension from Inflammatory depression patients (n/mice = 7), Non-inflammatory depression patients (n/mice = 8), HCs (n/mice = 7) and normal saline (n/mice = 9). The mice in the High inflammatory group consumed fewer sucrose in the sucrose preference test (SPT) (P = 0.012). In the open-field test (OFT), mice in the High-inflammatory group showed decreased activity (fewer total distance traveled) (P = 0.001) and increased anxiety (reduced travel in the exposed center region away from the walls) (P = 0.004). Similarly, the duration of immobility in the tail suspension test (TST) was increased in the High-inflammatory group mice (P = 0.061). The body weight of mice was significantly lower and the weight change of mice in the high inflammatory group was also smaller than that in other groups (P = 0.001). One-way ANOVA test for multiple comparisons with Tukey’s test for post hoc corrections. Data are presented as mean values with SD. Scatter plot indicate median and error range. The upper and lower whiskers indicate median ± SD. P-value is marked as follows: *P ≤ 0.05. ns indicates non-significant. C The movement trajectory of mice in OFT. D1 Alpha-diversity analysis exposed that the Simpson index were lower in High inflammatory group (n = 7) than that in the Low-inflammatory group (n = 8), HC group (n = 7) and Blank group (n = 9) (P = 0.0092). One-way ANOVA test for multiple comparisons with Tukey’s test for post hoc corrections. Data are presented as mean values with SD. Box plots indicate median and interquartile range. P-value is marked as follows: *P ≤ 0.05. D2 Beta diversity analysis uncovered a notable difference in bacterial community composition among High inflammatory group, Low-inflammatory group, HC group and Blank group as found by the PCoA plot based on Jaccard dissimilarity. D3 LEfSe analysis showed that the relative abundance of Bacteroidaceae, Bacteroides was significantly higher in the High-inflammatory group; however, the amount of Clostridia and Clostridiales was significantly higher in HC group. All statistical tests are two-sided. Source data are provided as a Source Data file.

