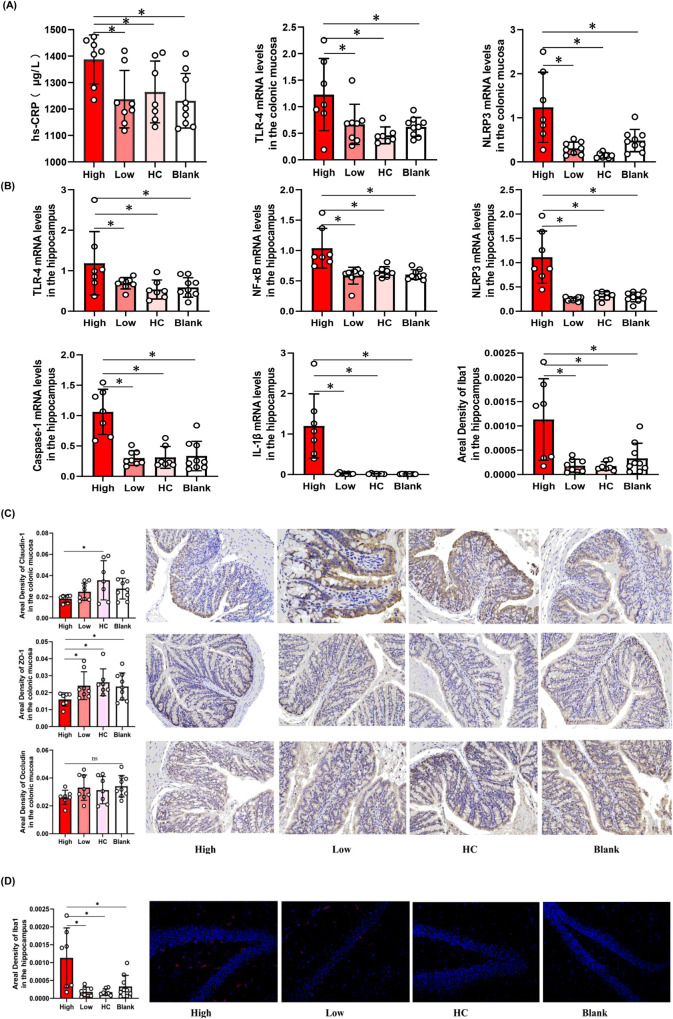
Fig. 5. Elevated inflammatory factors in the High inflammatory group.
A The expression of TLR-4 (P = 0.006), NLRP3 (P < 0.001) in the intestinal mucosa and the concentration of hs-CRP (P = 0.028) in the serum were elevated in the High inflammatory group (n = 7) compared to the Low-inflammatory group (n = 8), HC group (n = 7), Blank group (n = 9). B The expression of TLR-4 (P = 0.023), NF-κB (P < 0.001), NLRP3 (P < 0.001), Caspase-1 (P < 0.001) and the area density of Iba1 (P = 0.001) in the brain were increased in the High inflammatory group. C The amount and area density of permeability biomakers such as Claudin-1 (P = 0.043), ZO-1 (P = 0.003) were decreased in the High inflammatory by ELISA and immunohistochemistry (×400 magnificent). The area density of Occludin tended to decrease, but there was no statistical difference (P = 0.254). D The amount and branch of microglia in hippocampus were increased in the High inflammatory group. One-way ANOVA test for multiple comparisons with Tukey’s test for post hoc corrections. Data are presented as mean values with SD. Scatter plot indicate median and error range. The upper and lower whiskers indicate median± SD. P-value is marked as follows: *P ≤ 0.05. ns indicates non-significant. All statistical tests are two-sided. Source data are provided as a Source Data file.

