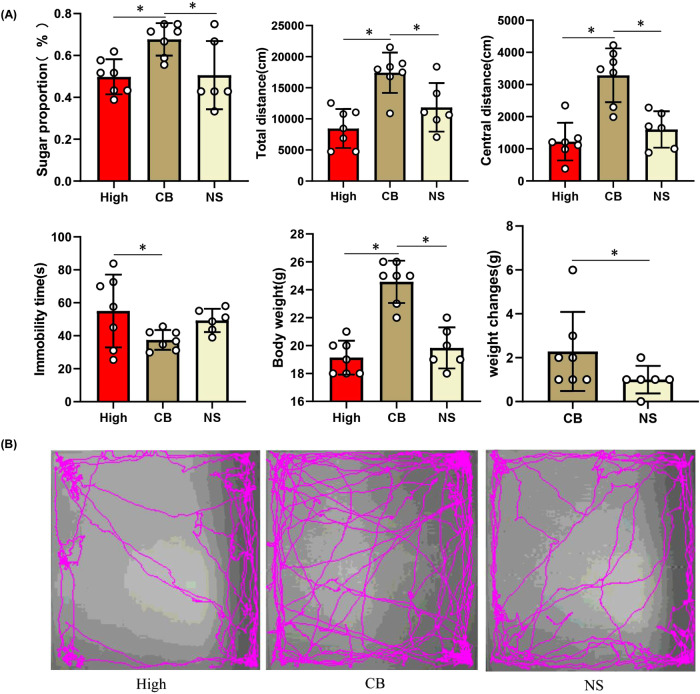
Fig. 8. Effects of probiotics (CB) on depression-like behaviors of the mouse model of inflammatory depression.
A The mice in the CB group (n = 7) consumed more sucrose in the SPT than that in High-inflammatory group (n = 7) and NS group (n = 6) (P = 0.013). In the OFT, mice in the CB group showed increased activity (longer total distance traveled) (P = 0.001) and decreased anxiety (induced travel in the exposed center region away from the walls) (P < 0.001). Similarly, the duration of immobility in the TST was decreased in the CB group mice (P = 0.048). The body weight of mice was significantly increased and the weight change of mice was also more in the CB group (P < 0.001). One-way ANOVA test for multiple comparisons with Tukey’s test for post hoc corrections. Data are presented as mean values with SD. Scatter plot indicate median and error range. The upper and lower whiskers indicate median ± SD. P-value is marked as follows: *P ≤ 0.05. ns indicates non-significant. B The movement trajectory of mice in OFT. All statistical tests are two-sided. Source data are provided as a Source Data File.

