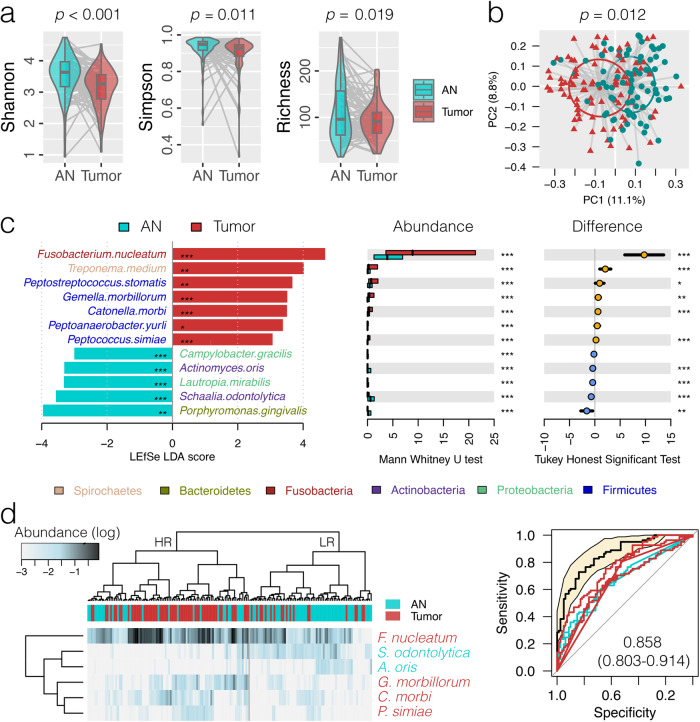
Fig. 1. Oral microbiota dysbiosis associated with oral cavity squamous cell carcinoma (OSCC).
a Comparison of the oral microbiota alpha diversity between OSCC tumor (tumor) and adjacent normal (AN) tissues at the amplicon sequence variant (ASV) level. The boxplot’s center line indicates the median value, the box bounds represent the first and third quartiles, and the whiskers extend to the smallest and largest values in the data, respectively. b Principal coordinate analysis plot based on weighted GUniFrac distance matrix inferred from ASVs. c Discriminative bacterial species as detected by linear discriminant analysis (LDA) effect size (LEfSe) analysis (score > 3, q < 0.05), which was further validated by at least two of the three compositional aware tools, ANCOM-BC2, ALDEx2 and ZicoSeq tests adjusted for the covariates of T stage and smoking (q < 0.05). The bar length represents log10 LDA score. Differences in the relative abundance were further tested by pairwise Mann–Whitney U test and Tukey HSD post hoc as shown on the right panels. *p < 0.05; **p < 0.01; ***p < 0.001. d Hierarchical cluster analysis using distance matrix of six discriminative bacterial species (LDA > 3, AUC > 0.65) classified the surveyed tissue samples into two clades.

