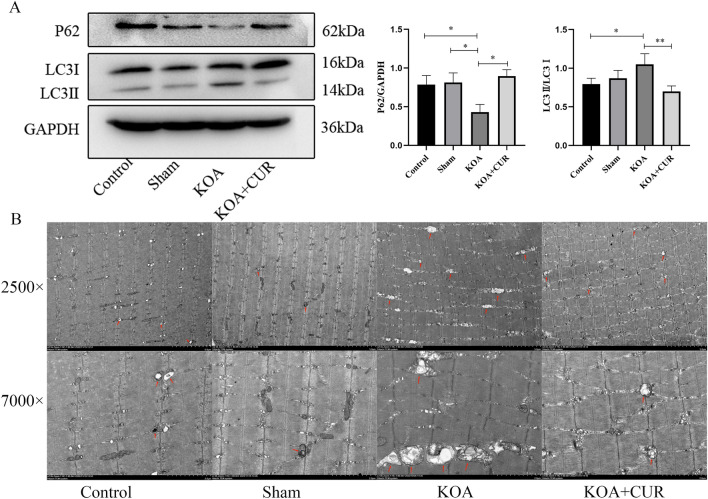
Figure 5.
Autophagy is hyperactivated in the quadriceps femoris muscle of KOA rats. (A) Changes in LC3 and P62 expression were assessed by Western blotting. Equal protein loading was normalized by GAPDH. Original blots/gels were presented in Supplementary Figs. S4–S6. *P < 0.05, **P < 0.01, ***P < 0.001. All data are expressed as mean ± SD, n = 3 for each group. (B) Abnormal morphology of autophagosomes and mitochondria in the quadriceps femoris muscle of KOA rats. Autophagosomes (red arrows). Images were acquired at 2500 × , scale bars = 5 μm. Images were acquired at 7000 × , scale bars = 2 μm. Control represents the blank control rats. Sham represents sham-operated group rats. KOA represents the KOA model group rats. KOA + CUR represents the treated group rats with feeding CUR.

