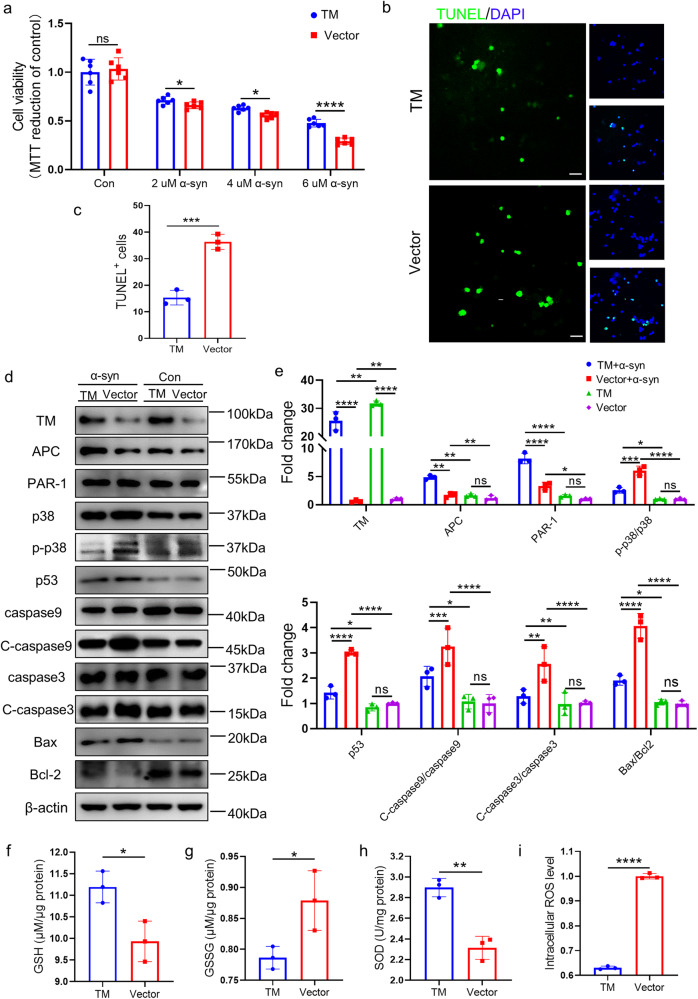
Fig. 3. TM reduces α-syn-induced cell apoptosis and oxidative stress.
a The effect of TM overexpression on the viability of primary neurons. Primary neurons (DIV8) with TM overexpression treated with different concentration of α-syn oligomers for 72 h, and then cells were detected by MTT assay. n = 6 represents technical replicates. Experiment was repeated at least three times. Data are mean ± SEM, and an unpaired t test with two-tailed was used for statistical analysis. b Primary neurons (DIV8) were treated with 2 μM α-syn oligomers for 72 h after infected with TM or control, then the cells were detected by TUNEL method. Scale bar represents 25 μm. c The fluorescent area of TUNEL+ cells in (b) was quantified by IpWin32 software. n = 3 represents three independent experiments. Data are mean ± SEM, and an unpaired t test with two-tailed was used for statistical analysis. d The effect of TM overexpression on the levels of TM, APC, RAR-1, p38, p-p38, p53, caspase9, Cleved-caspase9 (C-caspase9), caspase3, Cleved-caspase3 (C-caspase3), Bax and Bcl-2 in primary neurons after treated with 2 μM α-syn oligomers. β-actin was used as a control. e Relative levels of TM, APC, PAR-1, p-p38/p38, p53, C-caspase9/caspase9, C-caspase3/caspase3, Bax and Bcl-2 in (d) were quantified using Image J software, respectively. n = 3 represents three independent experiments. Data are mean ± SEM, and a one-way ANOVA followed by Tukey’s multiple comparison test. f–i The effect of TM overexpression on the levels of oxidative stress (GSH, GSSG, SOD and ROS). Primary neurons infected with TM or Vector were incubated with 2 μM α-syn oligomers for 48 h. Then the levels of oxidative stress were detected by ELISA kit. n = 3 represents three independent experiments. Data are mean ± SEM, and an unpaired t test with two-tailed was used for statistical analysis. *P < 0.05, **P < 0.01, ***P < 0.001, ****P < 0.0001, ns not significant.

