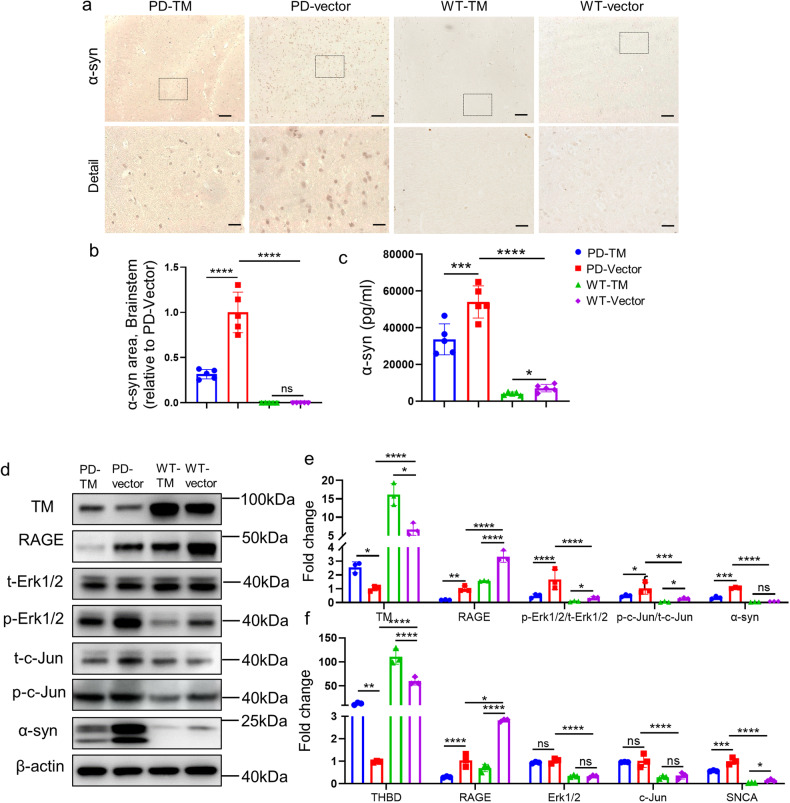
Fig. 5. TM reduces the level of α-syn in the brains of A53T mice.
a Representative images of α-syn in brainstem of mice treated with TM. Scale bar: 100 μm. b The area of α-syn in brainstem of mouse brains in (a) was quantified using IpWin32 software. n = 5 mice per group. Data are mean ± SEM, and a one-way ANOVA followed by Tukey’s multiple comparison test was used for statistical analysis. c α-syn in the brain homogenate of mice treated with TM were analyzed by ELISA kit. n = 5 mice per group. Data are mean ± SEM, and a one-way ANOVA followed by Tukey’s multiple comparison test was used for statistical analysis. d The levels of TM, RAGE, t-Erk1/2, p-Erk1/2, t-c-Jun, p-c-Jun and α-syn in the brainstem of A53T mice with TM overexpression were analyzed by western blotting. β-actin was used as a control. e Relative levels of TM, RAGE, t-Erk1/2, p-Erk1/2, t-c-Jun, p-c-Jun and α-syn in (d) were quantified using Image J software. n = 3 represents three independent experiments. Data are mean ± SEM, and a one-way ANOVA followed by Tukey’s multiple comparison test. f The mRNA levels of THBD, RAGE, Erk1/2, c-Jun and α-syn in the brainstem of mice with TM overexpression. n = 3 represents three independent experiments. Data are mean ± SEM, and a one-way ANOVA followed by Tukey’s multiple comparison test was used for statistical analysis. *P < 0.05, **P < 0.01, ***P < 0.001, ****P < 0.0001, ns not significant.

