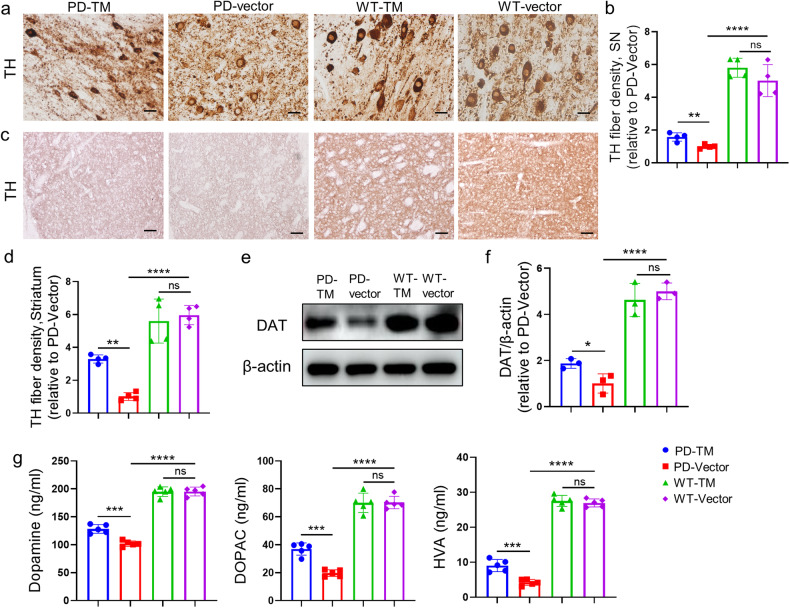
Fig. 6. TM improves the level of dopamine in the brains of A53T mice.
a The levels of TH in substantia nigra of mice with TM overexpression were detected by immunohistochemistry with anti-TH antibody. Scale bar: 20 μm. b Quantification of TH fiber densities in (a) using IpWin32 software. n = 4 mice per group. Data are mean ± SEM, and a one-way ANOVA followed by Tukey’s multiple comparison test was used for statistical analysis. c The levels of TH in striatum of mice with TM overexpression were detected by IHC. Scale bar: 100 μm. d Quantification of TH fiber densities in (c) using IpWin32 software. n = 4 mice per group. Data are mean ± SEM, and a one-way ANOVA followed by Tukey’s multiple comparison test was used for statistical analysis. e The levels of DAT in substantia nigra of A53T mice with TM overexpression were analyzed by western blotting. β-actin was used as a control. f Densitometry analysis of DAT in (e). n = 3 represents three independent experiments. Data are mean ± SEM, and an unpaired t test with two-tailed was used for statistical analysis. g DA and its metabolites DOPAC, HVA in the brainstem of mice treated with or without TM were analyzed by ELISA kit. n = 5 mice per group. Data are mean ± SEM, and a one-way ANOVA followed by Tukey’s multiple comparison test was used for statistical analysis. *P < 0.05, **P < 0.01, ***P < 0.001, ****P < 0.0001, ns, not significant.

