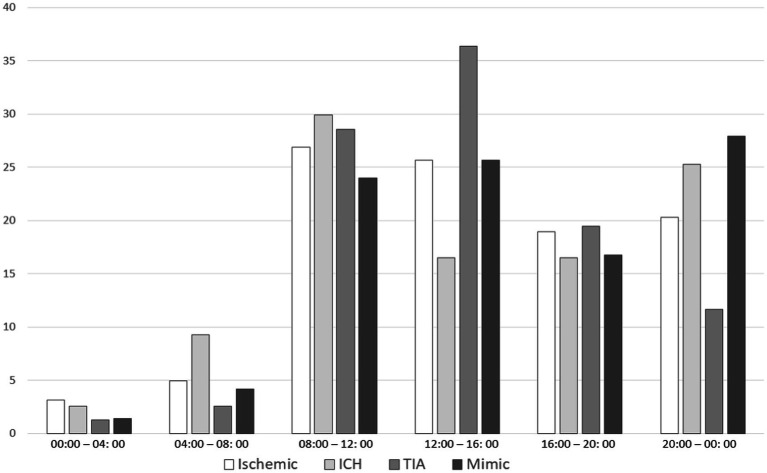
Figure 1.
Distribution of stroke subtypes by the onset of symptoms. Figure 1 shows the percentage of stroke subtypes (ischemic, intracerebral hemorrhage (ICH), TIA, and mimic) by 4-h periods of day. Each graph bar value corresponds to the proportion of patients in each period within their respective stroke subtype group. Wake-up strokes have been excluded from this analysis.

