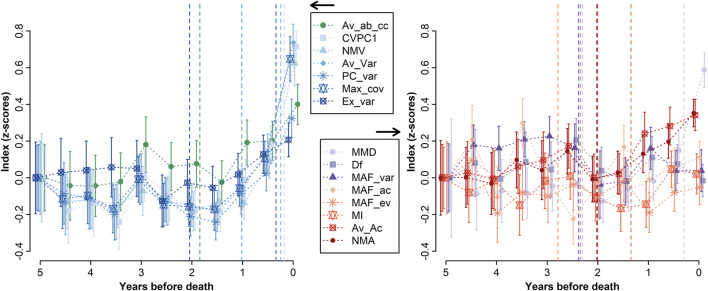
FIGURE 3.
Trend before death for each index. Indices were averaged by time window, and means were plotted along with the 95% confidence intervals. All indices were z-transformed and centered at 5 years before death for ease of comparison, and were split into two graphs for ease of visualization. Vertical dashed lines indicate the results from change point analyses, i.e., the break point in values trend. Note that change point analyses were performed using the indices calculated with a 3-month time window for a better time resolution, although the results are plotted here against the 6-month trends. The best performing indices are all variance-based, except MMD, which is also based on AC.

