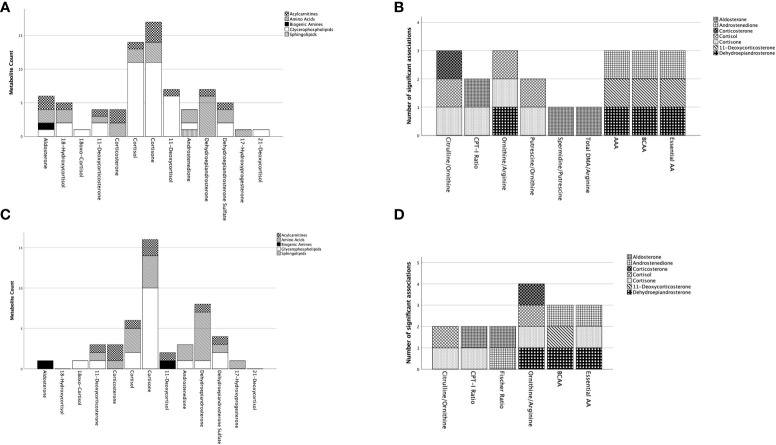
Figure 3.
Summary of significant associations of adrenal steroids on the included metabolites and metabolic indices in patients with primary aldosteronism. Represented are metabolites and metabolites indices for which the model in the multiple regression analyses resulted significant ( Supplementary Tables 3.5, 3.6 ). In (A) (with adjustment for age/sex) and (C) (with adjustment for age/sex/BMI/DM) on the x-axis are represented the adrenal steroids with the total number of metabolites being significantly predicted for each steroid on the y-axis. The metabolites are represented by groups (acylcarnitines, amino acids, biogenic amines, glycerophospholipids, sphingolipids) defined by distinct pattering as specified in the figure legend. To note is that one metabolite might have significant associations with multiple adrenal steroids. (B) (with adjustment for age/sex) and (D) (with adjustment for age/sex/BMI/DM) represent the metabolite indices on the x-axis and the total number of adrenal steroid(s) significantly associated with the metabolic indices on the y-axis. Each adrenal steroid is represented by a different pattern as specified in the figure legend. AA, amino acids; AAA, aromatic amino acids; BCAA, branched chain amino acids; CPT-I ratio, carnitine palmitoyltransferase I ratio; DMA, dimethylarginine.

