Figure 1.
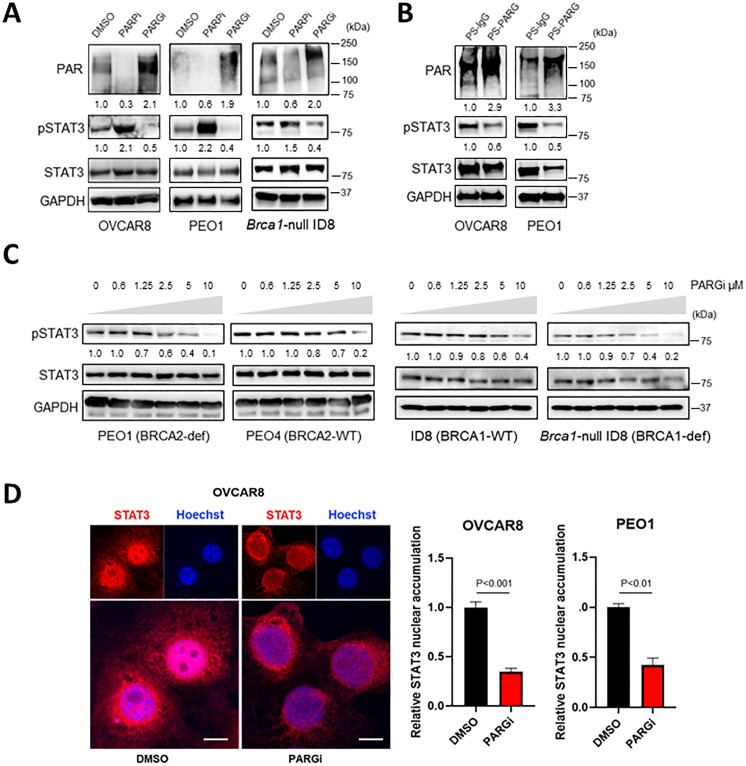
PARG inhibition decreases STAT3 Y705 phosphorylation and signaling. (A) Immunoblot analysis comparing total PARylation, phospho-STAT3 Tyr 705 (pSTAT3), total STAT3 (STAT3), and loading controls in BRCA-proficient OVCAR8, BRCA2-deficient PEO1, and Brca1-null ID8 cells after vehicle (DMSO), 10 µM olaparib (PARPi), or 10 µM COH34 (PARGi) overnight incubation. The image represents three independent experiments. (B) Immunoblotting of the indicated cell lines cultured with the PS-modified control (PS-IgG) or PARG (PS-PARG) antibody (20 µg/mL, overnight). The image represents two independent experiments. (C) Dose-dependent pSTAT3 inhibition by COH34 at indicated doses in BRCA-proficient and BRCA-deficient ovarian cancer cells analyzed by immunoblotting. The images represent two independent experiments. GAPDH was used as the loading control. (D) Immunofluorescent staining and confocal microscopic images (left) showing STAT3 (red) and nuclear staining (blue) of the indicated ovarian cancer cell lines treated with DMSO or 10 µM PARGi overnight. The scale bars represent 10 µm. Histograms (right) showing STAT3 nuclear accumulation. Data shown are mean±SD from three experiments. The protein levels of PAR or pSTAT3 shown in the immunoblotting images were quantified by band intensity using ImageJ software and normalized with GAPDH. DMSO, Dimethyl sulfoxide; GAPDH, Glyceraldehyde 3-phosphate dehydrogenase; PARG, poly(ADP-ribose) glycohydrolase; STAT3, signal transducer and activator of transcription 3.

