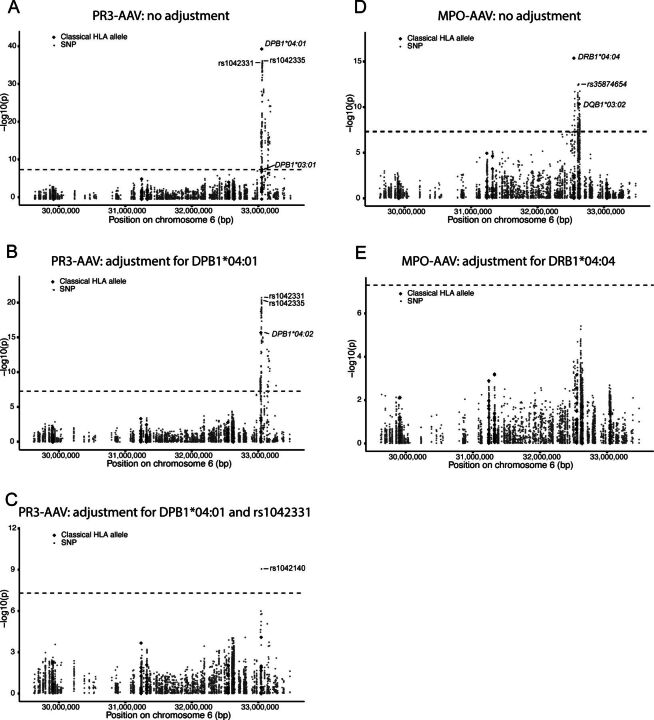
Figure 1.
Genetic association analyses of the human leucocyte antigen (HLA) region in antineutrophil cytoplasmic antibody-associated vasculitides (AAV). Manhattan plots depicting signals of association between a combined dataset of HLA alleles and single-nucleotide polymorphisms (SNPs) and proteinase 3 (PR3)-AAV (A–C) and myeloperoxidase (MPO)-AAV (D–E), respectively. Plots show results without conditioning on any genetic variant (A, D) and conditioning on lead variants: HLA-DPB1*04:01 (B), HLA-DPB1*04:01 and rs1042331 (C) in PR3-AAV and HLA-DRB1*04:04 (E) in MPO-AAV. Significantly associated classical HLA alleles and lead SNPs are marked with ID. The −log10 of the p value of each HLA allele/SNP is plotted against the physical location of the variant in the HLA region on chromosome 6. Dashed black line corresponds to the p value threshold for significance (p <5 × 10⁻⁸). Diamonds=classical HLA alleles; dots=SNPs.

