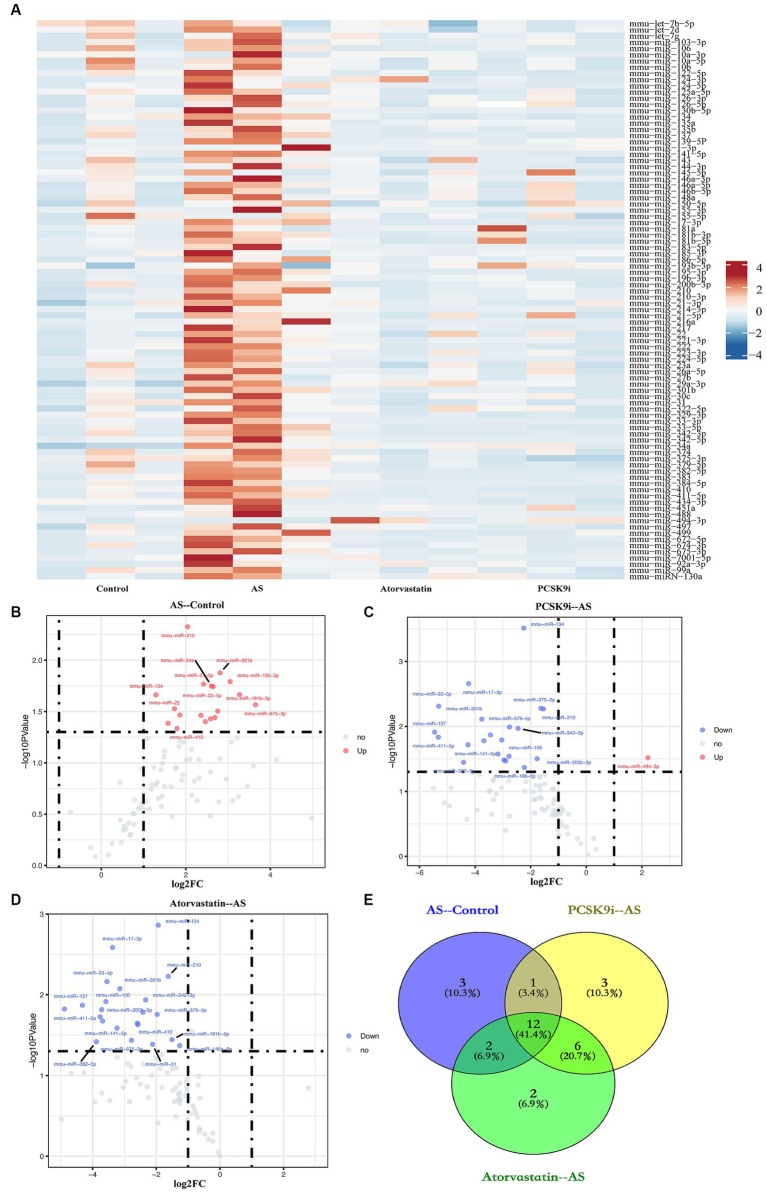
Figure 2.
Identification of DEMs. (A) Heatmap of miRNA expression in aortic tissues from four groups of ApoE−/− mice. (B–D) The volcano plots show the fold change (FC) and statistical significance of DEMs between each group (B: AS compared to the control; C: PCSK9i compared to the AS; D: Atorvastatin compared to the AS). (E) Venn diagram showing number of genes overlapped in each group. Spots above the horizontal midline represent statistically significant DEMs. FC >1.2 or < 0.833 and p < 0.05 represent the downregulated and upregulated significant DEMs, respectively.

