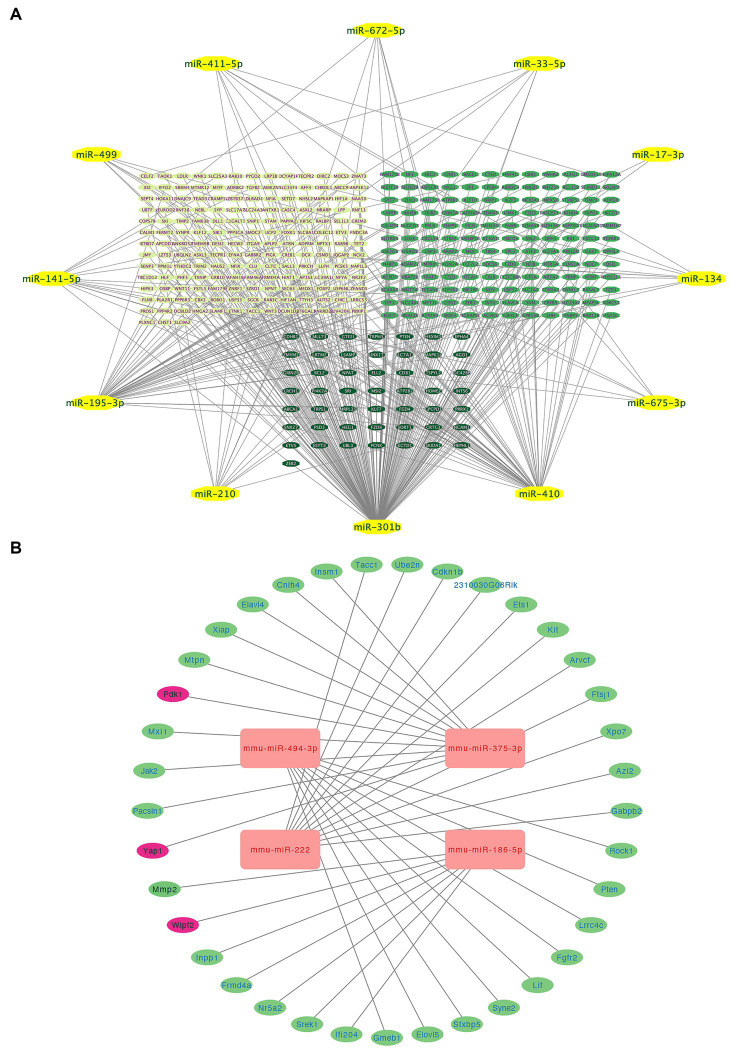
Figure 3.
Integrated visualization showcasing miRNA-target gene interactions and enrichment analysis. (A) Relationships between various miRNAs and their respective target genes. (B) Network visualization of four uniquely regulated miRNAs by PCSK9i and their downstream target genes. MiRNAs are represented in yellow (A) and red (B), and the lines indicate regulatory connections between miRNAs and target genes.

