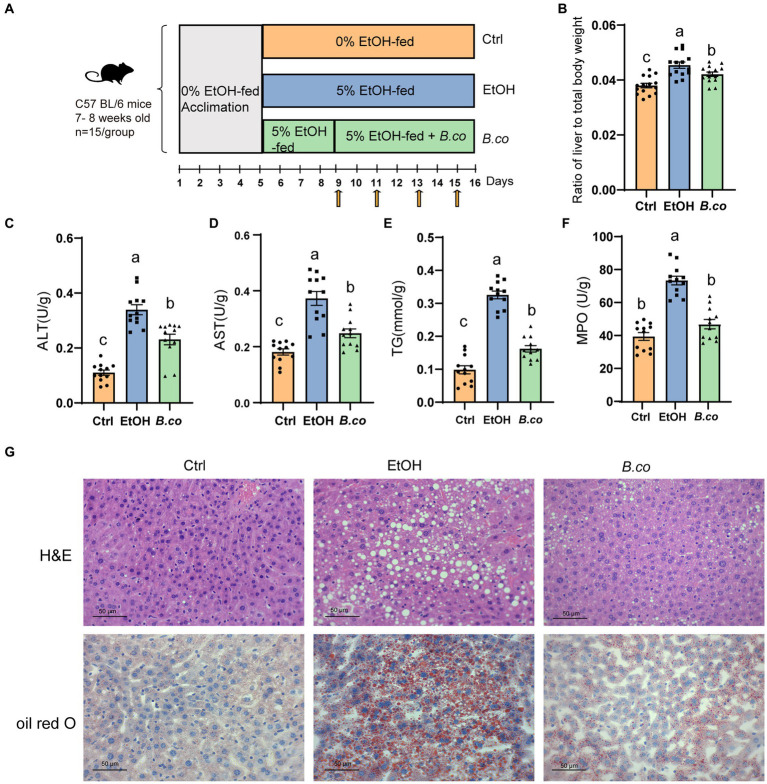
Figure 1.
B. coagulans reduced histological damage of liver induced by ethanol. (A) Diagram illustrating the mouse model of ethanol-induced ALD employed in this study. Arrows indicate gavage phosphate bufer saline (PBS) or B. coagulans treatments. (B) Liver-to-body-weight ratio. (C) Serum ALT concentration. (D) Serum AST concentration. (E) Liver triglyceride concentration. (F) Liver myeloperoxidase activity. (G) Histological assessment of steatosis with representative pictures of H&E staining (up) and oil-red-O stained (down) liver sections. Scale bars represent 50 μm. The concentrations of panels (C,D,F) were calculated as follows: Activity calculated using the kit (U/L)/ total protein concentration (g/L). Data are shown as means ± SEM. Data with different superscript letters (a, b, and c) are significantly different (p < 0.05) according to one-way ANOVA followed by Tukey’s test. Ctrl, healthy control group; EtOH, ethanol-induced group; B. co, supplementation of B. coagulans group.

