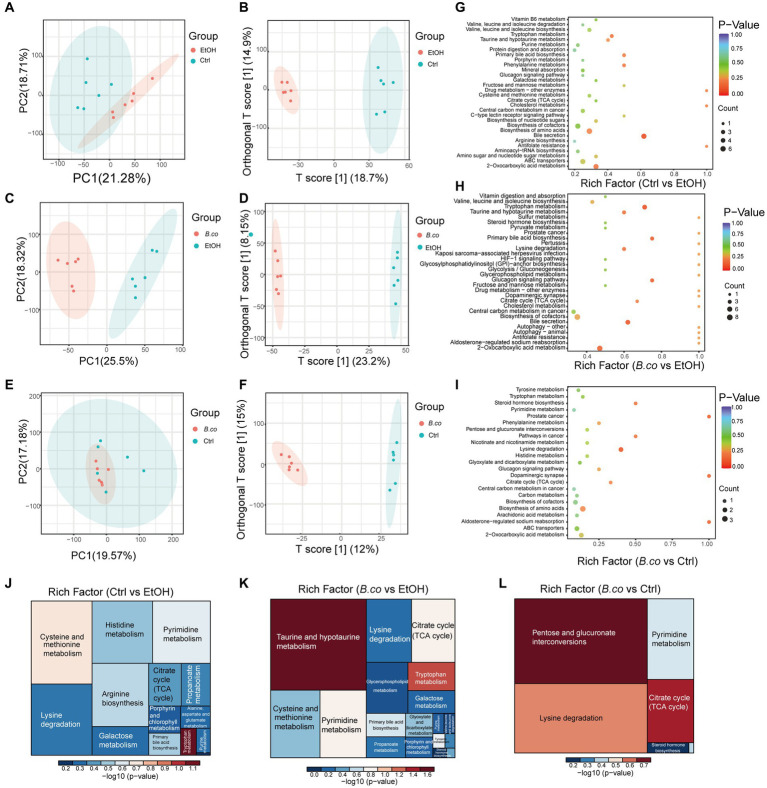
Figure 5.
Metabolic patterns in the experiment groups. (A) PCA analysis between healthy control group and ethanol-induced group. (B) Clustering analysis of OPLS-DA in the healthy control group and ethanol-induced group. (C) PCA analysis between B. coagulans-treated group and ethanol-induced group. (D) Clustering analysis of OPLS-DA in the B. coagulans-treated group and ethanol-induced group. (E) PCA analysis between B. coagulans-treated group and healthy control group. (F) Clustering analysis of OPLS-DA in the B. coagulans-treated group and healthy control group. (G) The KEGG pathways in the healthy control group and ethanol-induced group. (H) The KEGG pathways in the B. coagulans-treated group and ethanol-induced group. (I) The KEGG pathways in the B. coagulans-treated group and healthy control group. (J) Pathway analysis for group ethanol-induced vs. healthy control. (K) Pathway analysis for group B. coagulans-treated vs. ethanol-induced. (L) Pathway analysis for group B. coagulans-treated vs. healthy control. Ctrl, healthy control group; EtOH, ethanol-induced group; B. co, supplementation of B. coagulans group.

