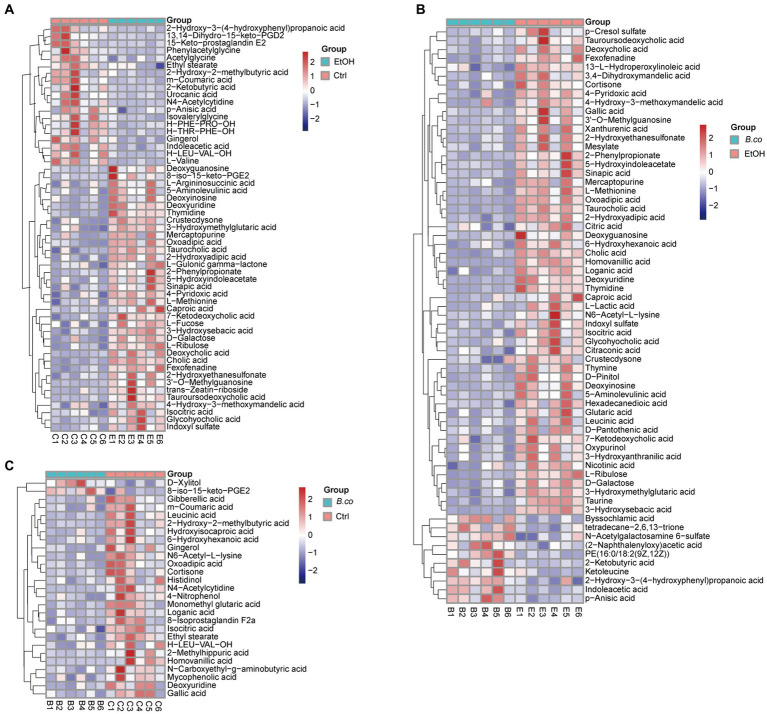
Figure 6.
The heatmap of hierarchical clustering analysis different metabolites. (A) The heatmap of different metabolites for group healthy control vs. ethanol-induced. (B) The heatmap of different metabolites for group B. coagulans-treated vs. ethanol-induced. (C) The heatmap of different metabolites for group B. coagulans-treated vs. healthy control. Ctrl, healthy control group; EtOH, ethanol-induced group; B. co, supplementation of B. coagulans group.

