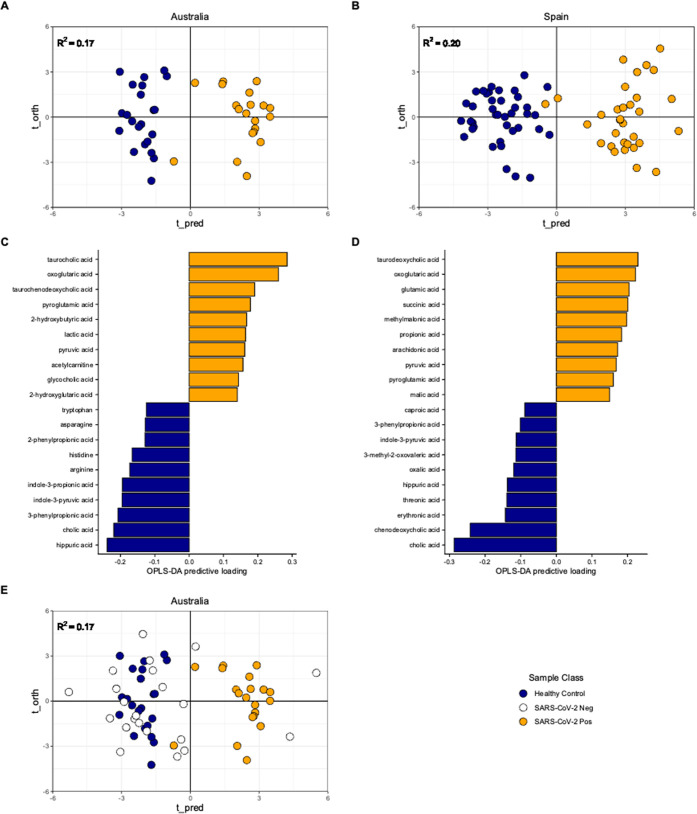
Figure 1.
Orthogonal Projections to Latent Structures Discriminant Analysis (OPLS-DA) models of the study samples. Panels A and B present OPLS-DA score plots indicating supervised separation of healthy control and SARS-CoV-2 positive groups in both studies and biofluid types. Panels C and D present the metabolite feature loadings that have the greatest influence and drive the OPLS-DA model separation. Panel E presents SARS-CoV-2 negative data from the Australian cohort projected onto the Healthy Control vs SARS-CoV-2 positive Australian model in panel A.

