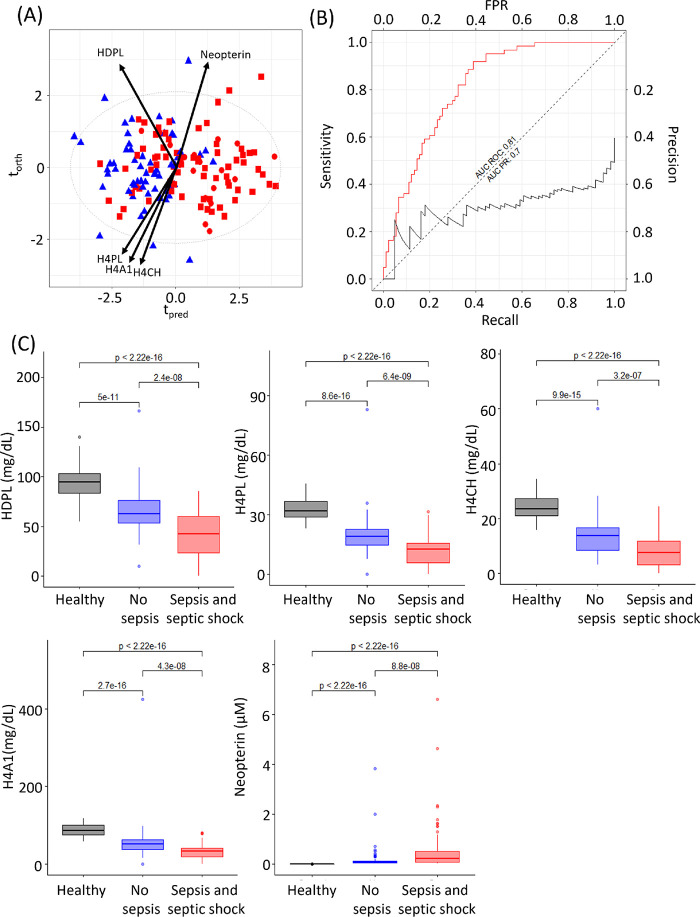
Figure 1.
O-PLS-DA of nonsepsis (blue triangle) vs sepsis (red square) and septic shock (red circle) within 48 h of admission into ICU (R2X = 0.72, CV-AUROC = 0.80), arrows indicate loadings of neopterin, HDPL, H4PL, H4A1, and H4CH. (B) Area under the ROC and area under the precision recall curve for this model (model 1 AUC ROC = 0.81 (red line), model 1 AUC PR = 0.7 (black line). (C) Box plots of HDPL, H4PL, H4CH, H4A1 and neopterin for healthy participants, no sepsis ICU patients, and sepsis and septic shock ICU patients. Significance levels of the Mann–Whitney tests are shown for comparison of the groups.

