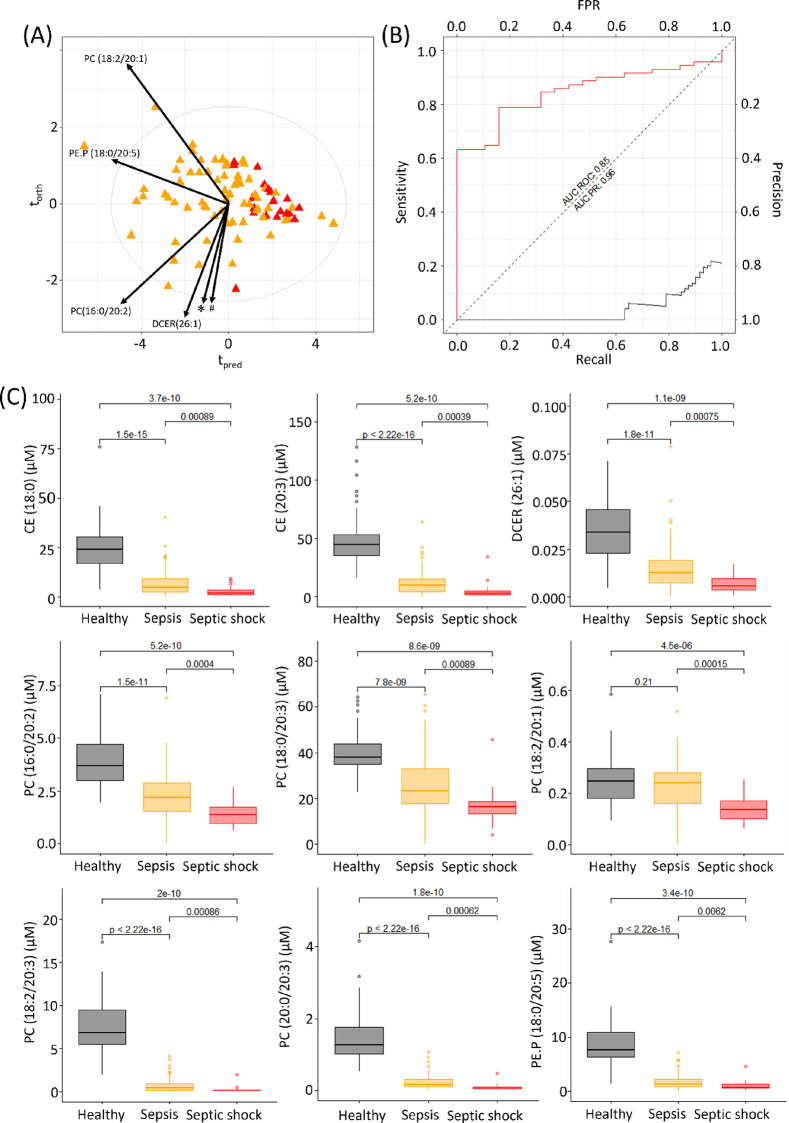
Figure 2.
O-PLS-DA of septic (orange) versus septic shock (red) patients within 48 h of admission into ICU (R2X = 0.64, CV-AUROC = 0.81), arrows indicate loadings of the lipids, * = CE(18:2), PC(18:0/20:3); # = PC(20:0/20:3), CE(18:0), PC(18:2/20:3), and CE(20:3). (B) Area under the ROC and area under the precision recall curve for this model (AUC ROC = 0.85 (red line), model 2 AUC PR = 0.96 (black line). (C) Box plots of the lipids included in the model 2 analysis for healthy participants, sepsis, and septic shock patients. Significance levels of the Mann–Whitney tests are shown for the comparison of the 3 groups. CE(18:2) is not shown here as a box plot comparison as it did not pass quality control requirements in the healthy control cohort (variability was above 30% in the long term reference QC samples).

