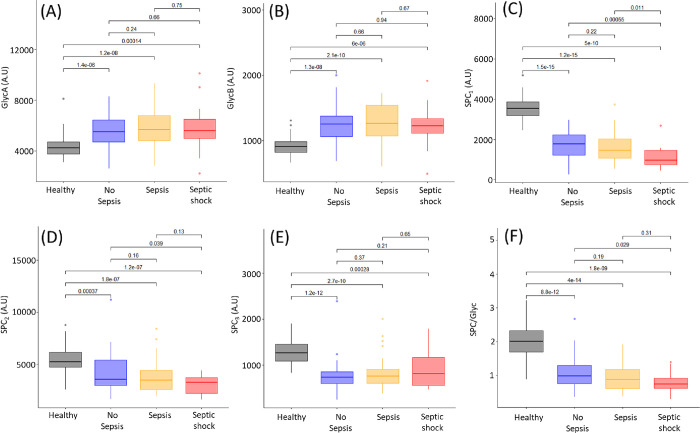
Figure 4.
Box plots of healthy controls (black), patients with no sepsis (blue), patients with sepsis (yellow), and patients with septic shock (red) for the glycoproteins and SPC 48 h post-collection of the first blood sample at admission in ICU. Mann–Whitney-U tests between the groups are shown above the corresponding plots. (A) GlycA, (B) GlycB, (C) SPC1, (D) SPC2, (E) SPC3, (F) SPC/Glyc.

