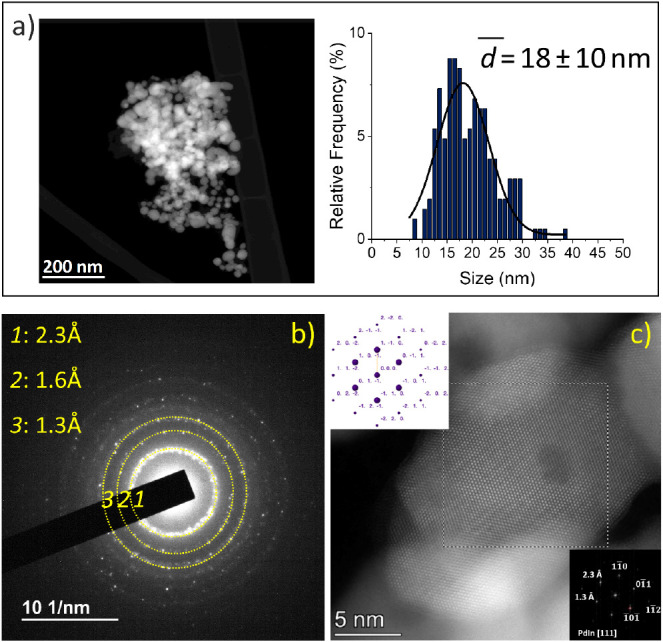
Figure 2.

Electron microscopy characterization of PdIn-T. (a) Representative HAADF image and nanoparticle size distribution, (b) SAED pattern, (c) representative HR-HAADF STEM image of the PdIn-T catalyst. The digital diffraction pattern from the boxed area (shown as inset in the lower right part) could be indexed as that corresponding to the [111] zone axis of Pd1In1 intermetallic. The image shows in this case contributions of 2.3 Å planes ({110}) at 60° and one at 1.3 Å {112}. Note the perfect match with the simulated diffraction pattern for this phase down the [111] zone axis.
