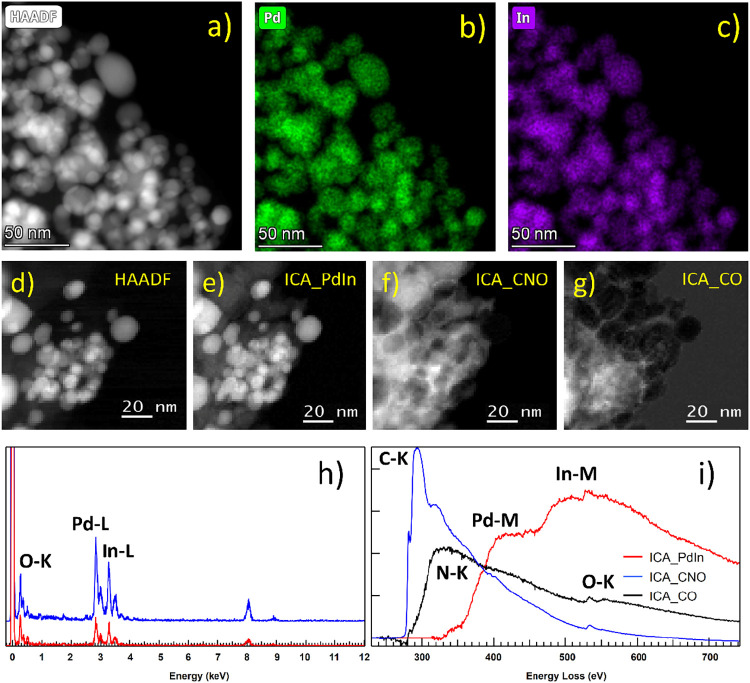
Figure 5.
STEM–EDX and STEM–EELS of PdIn-QT sample. (a) HAADF image and the corresponding chemical maps extracted from the STEM–SI–EDS, (b) Pd and (c) In, and (h) a representative EDS spectrum. STEM–EELS study including (d) a HAADF image; and the images corresponding to the three components of the ICA analysis of the whole set of STEM–EELS–SI data (e), (f), and (g). (i) EELS spectra corresponding to the three independent components, a Pd–In component, a C–N–O component, and an external C–O component.

