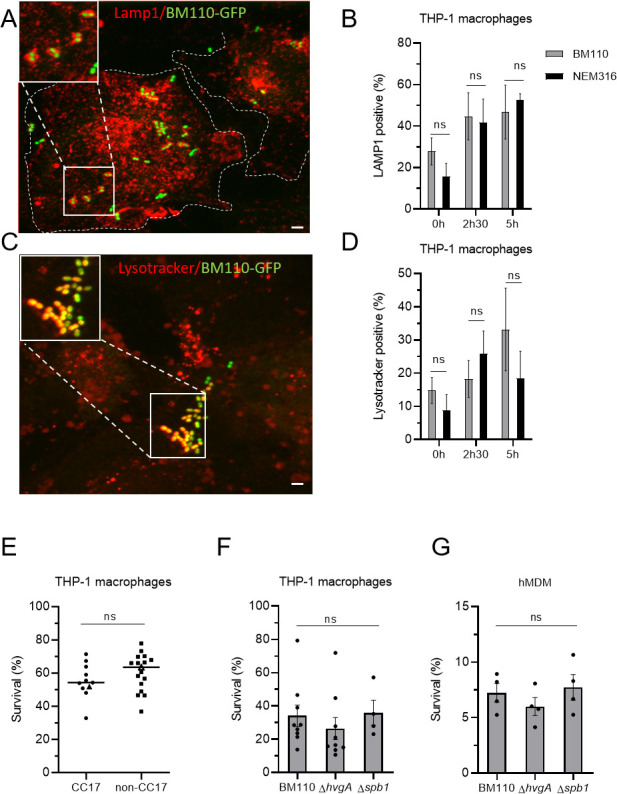
Fig 7.

CC17 and non-CC17 GBS strains exhibit similar intracellular fate. (A–D) Intracellular fate of BM110 and NEM316 strains was followed by microscopy in THP-1 macrophages. (A, C) Representative confocal microscopy images of THP-1 macrophages infected with BM110-GFP (green) and labeled with (A) anti-LAMP1 antibody (red) or (C) Lysotracker (red). Boxed areas correspond to the magnification of insets. Dotted lines indicate cell perimeters. Scale bar: 5 µm. (B, D) Quantification of BM110-GFP and NEM316-GFP associated with (B) LAMP1 or (D) Lysotracker was performed at 0, 2h30, or 5 h post-phagocytosis. Results are expressed as the percentage of bacteria positive for (B) LAMP1 or (D) Lysotracker staining. (E, F, G) Percentage of bacterial survival was assessed by CFU count 2h30 after phagocytosis in (E, F) THP-1 macrophage or (G) hMDM. (E) Macrophages were infected with CC17 and non-CC17 GBS clinical isolates from invasive infections, each dot representing a clinical strain. For each strain, results are expressed as the percentage of survival relative to the corresponding level of phagocytosis, with horizontal lines indicating the median value. Triangles correspond to BM110 strain (CC17) and NEM316 (non-CC17) (F, G) THP-1 macrophages were infected with the BM110 strain and its derivative mutant strains (ΔhvgA or Δspb1). Results are expressed as the percentage of viable intracellular bacteria normalized to the initial intracellular load (phagocytosis). Statistical analysis: data shown are mean ± SEM of at least four independent experiments. (B, D) Two-way ANOVA with Tuckey multiple comparison, (E) t test, or (F) Kruskall Wallis test with Dunn’s multiple comparisons or (G) one-way ANOVA tests was performed with ns, non-significant.
