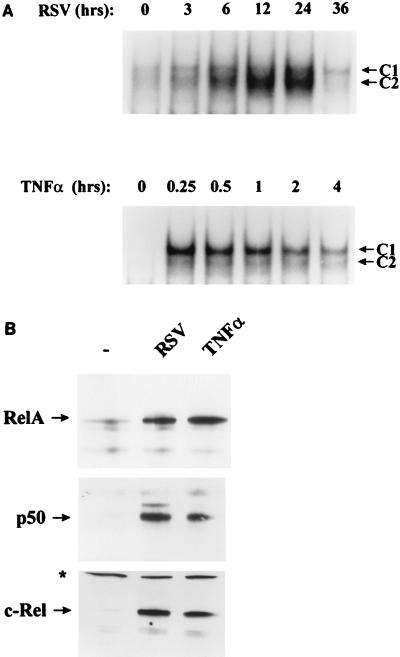
FIG. 1.
NF-κB activation and translocation in RSV-infected and rhTNF-α-stimulated A549 cells. (A) NF-κB binding to the IL-8 promoter in EMSA. A549 cells were infected with pRSV (MOI of 1) or stimulated with 20 ng of rhTNF-α per ml for different periods of time. Shown is an autoradiogram of EMSA using a nuclear extract binding the IL-8 TNF-responsive element (nucleotides −96 to −69; see Materials and Methods), with the autoradiographic exposure of the pRSV time course 1.5 times longer than that for the rhTNF-α time course (to demonstrate relative C1/C2 induction patterns). C1 and C2 are the inducible NF-κB complexes predominantly containing RelA (17). For pRSV, activation relative to control binding is 1.23-fold (3 h), 1.74-fold (6 h), 1.9-fold (12 h), 2.6-fold (24 h), or 1-fold (36 h). For rhTNF-α, C1/C2 activation is 8.12-fold (0.25 h), 7.9-fold (0.5 h), 7.3-fold (1 h), 6.3-fold (2 h), or 5.2-fold (4 h). (B) Nuclear abundance of NF-κB family members measured by Western immunoblotting. Nuclear extracts (216 μg) from control, pRSV-infected (24 h), and rhTNF-α-treated (15 min) cells were fractionated and probed with anti-RelA, -NF-κB1, and -c-Rel antibodies. The levels of the 65-kDa RelA, 50-kDa NF-κB1, and 75-kDa c-Rel proteins were increased following either pRSV or rhTNF-α treatment. ∗, nonspecific protein detected by c-Rel antibody, confirming equivalent loading.

