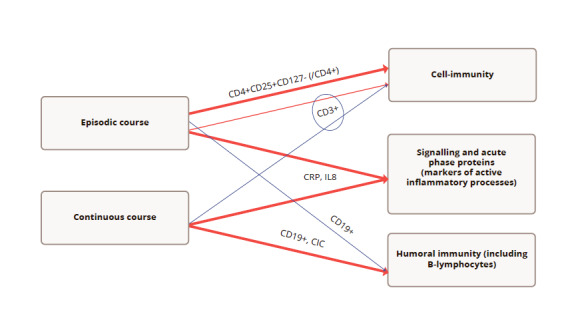
Figure 2. Figure 2. Key results of the study.

Note: red – increase vs. control, dark blue – decrease vs. control. Thick line – statistically significant difference vs. control; thin – non-significant difference vs. control; circle – difference between clinical groups. CRP – marker of active inflammation; IL8 – proinflammatory chemokine; CD19+ - B-lymphocytes; CIC – CD3+ T-cells; CD4+CD25+CD127- (/CD4+) - regulatory T-cells (% from CD45+CD3+CD4+ lymphocytes)
