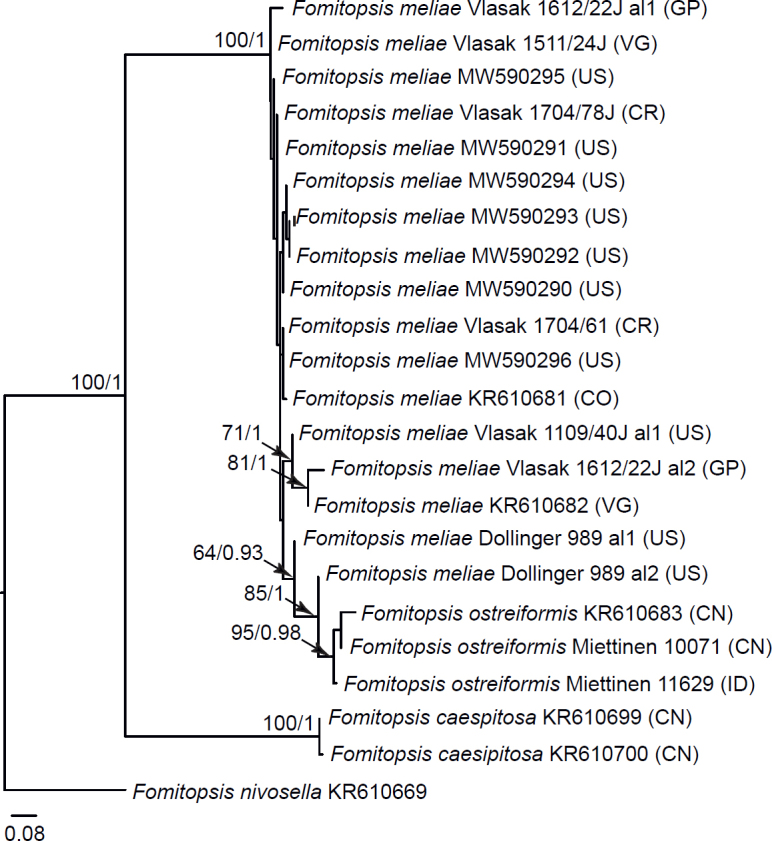
Fig 8.

Phylogenetic relationships of species in the Fomitopsis meliae complex based on Maximum Likelihood of the ITS + TEF1 dataset. Numbers on nodes represent bootstrap values > 70 % and Bayesian Inference posterior probabilities > 0.85. The scale bar indicates the number of expected substitutions per site. Two-letter codes in the parentheses denote the country of origin.
