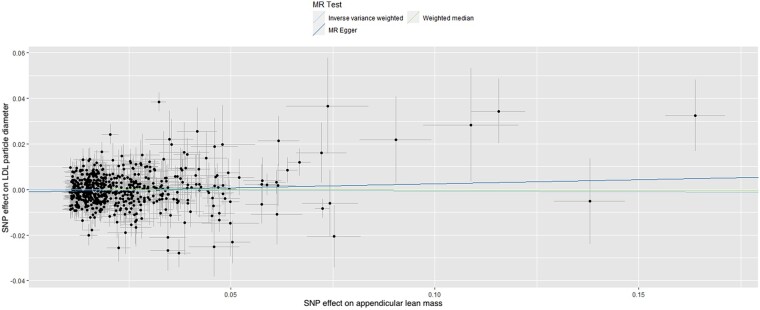
Figure 3.
Scatter plot of the association of the effect of single nucleotide polymorphism-determined serum appendicular lean mass on low-density lipoprotein particle diameter. Each point represents an single nucleotide polymorphism, plotted by the estimate of single nucleotide polymorphism on appendicular lean mass (x-axis, kg) and the estimate of single nucleotide polymorphism on low-density lipoprotein particle diameter (y-axis, nm). The slopes of each line represent the potential causal associations for each method. LDL, low-density lipoprotein; MR, high-density lipoprotein; SNP, single nucleotide polymorphism.

