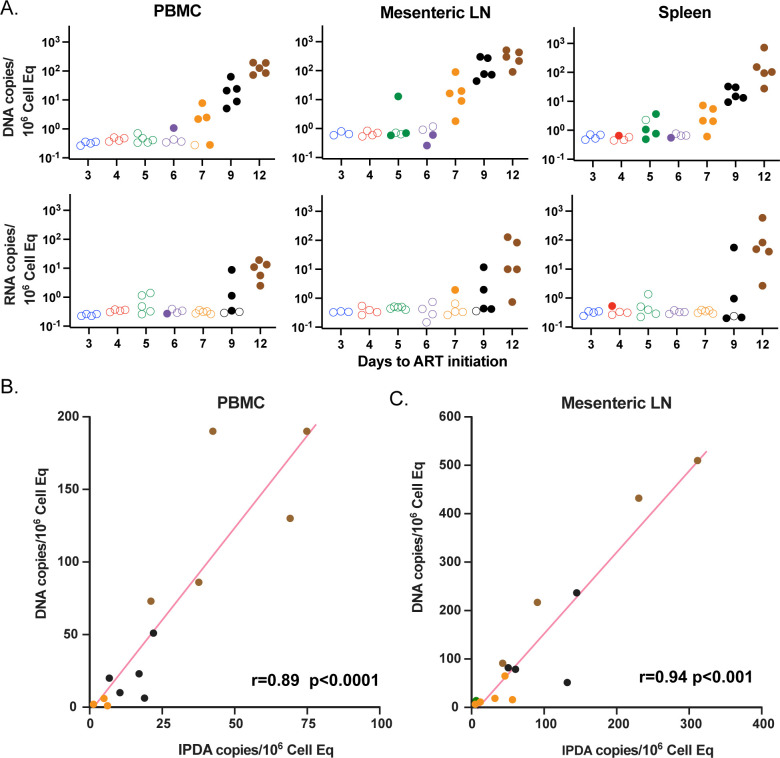
Fig 3. SIV CA-DNA, SIV CA-RNA, and IPDA levels prior to ART interruption using CA-DNA and RNA values and IPDA.
Viral RNA and DNA copies/million cells from PBMC, mesenteric LN, and spleen just prior to ART release (A). Unfilled symbols represent samples with no viral signal detected and are plotted at the calculated LOD for each sample based on specimen input. IPDA vs CA-DNA measurements in PBMC (B) and mesenteric LNMCs (C). Groups are color-coded based on days post infection until ART: d3 (blue), d4 (red), d5 (green), d6 (purple), d7 (orange), d9 (black) and d12 (brown).

