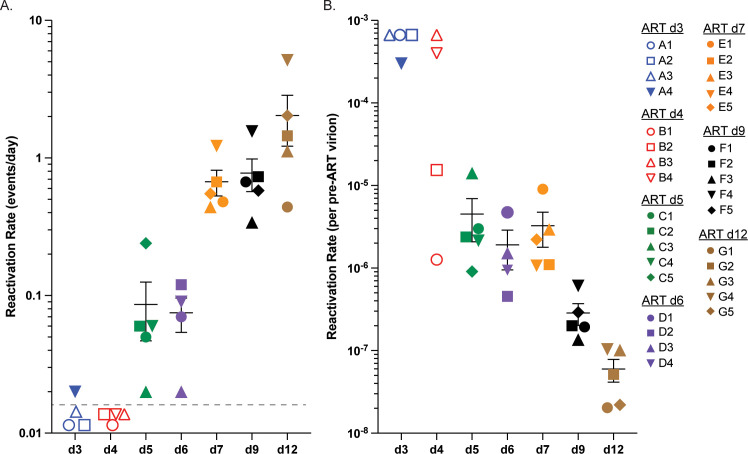
Fig 6. Reactivation rates.
Reactivation rates (events per day) of individual RMs within each treatment group are shown with RM-specific symbols (A). Reactivation rates from non-rebounding RMs are shown with open symbol set at LOD of 0.01 events/day. The pre-ART per virion reactivation rate is plotted for each individual RM using LOD and open symbols for RMs that did not rebound (B). No significant differences were found between RMs in group 5, 6 and 7 (p>0.4), however they were each significantly different from groups d9 and d12 (p<0.05), and the latter two groups were also significantly different from each other (p = 0.016). The average rate of d5, d6, and d7 was significantly different from the d9 RMs (12-fold, p<0.001) and d12 RMs (74-fold, p<0.001). Groups are color-coded based on days post infection until ART: d3 (blue), d4 (red), d5 (green), d6 (purple), d7 (orange), d9 (black) and d12 (brown).

