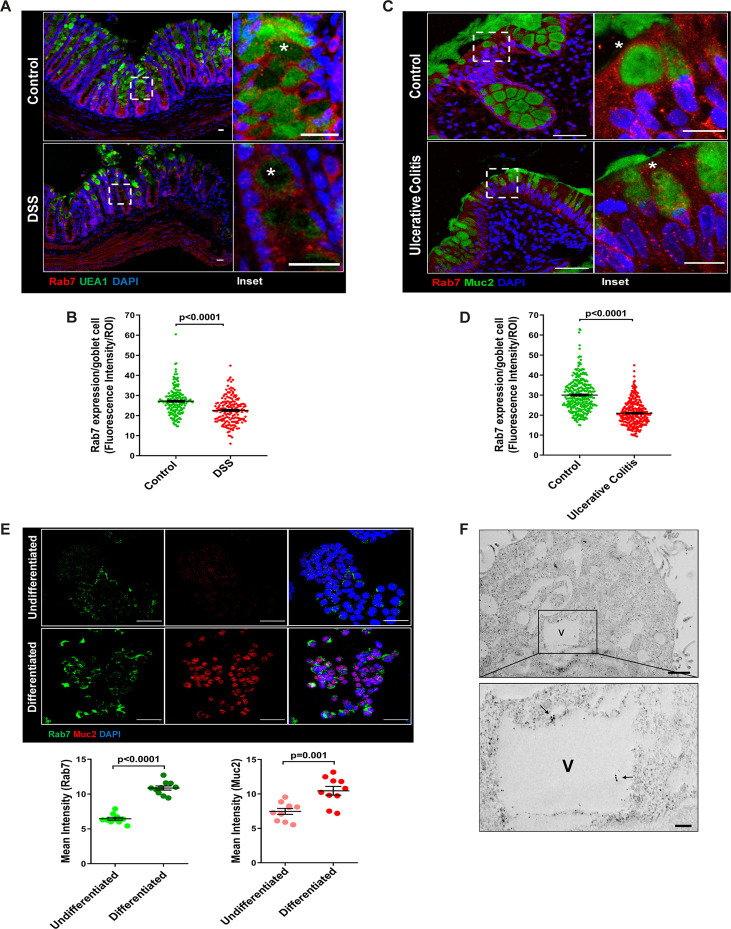
Figure 2. Goblet cells of intestine display dominant expression of Rab7.
(A, B) Confocal imaging of healthy and dextran sulfate sodium (DSS)-treated mice (7 d) colon sections showing Rab7 (red) expression within goblet cells (UEA1-FITC) marked with asterisk. Inset shows zoomed areas of the image (scale bar = 20 µm). Graph shows Rab7 fluorescence intensity within UEA1 positive goblet cells measured within region of interest (ROI). 20 goblet cells were selected randomly from three different fields of each mouse (n = 3). (C, D) Representative co-immunofluorescence images of human ulcerative colitis (UC) and control colon biopsy sections stained for Rab7 (red) and Muc2 (green) for goblet cells (marked with asterisk) (scale bar = 50 µm). Inset shows zoomed areas of the image (scale bar = 20 µm). Graph shows Rab7 fluorescence intensity within Muc2-positive goblet cells measured within ROI. 20 goblet cells were selected randomly from five different fields of each sample (n = 3). (E) Co-immunofluorescence of Rab7 (green) and Muc2 (red) in undifferentiated and differentiated HT-29 cells (scale bar = 50 µm). Graphs show Rab7 and Muc2 fluorescence intensity measured in 10 different fields of three independent experiments each. (F) Rab7 protein visualized in HT29-MTX-E12 cells by immune-EM. Arrows indicate presence of Rab7 on vacuoles of cells (scale bar = 1 µm). Inset showed zoomed area of image (scale bar = 200 nm). Error bars represent mean + SEM. Statistical analysis by Student’s t-test.


