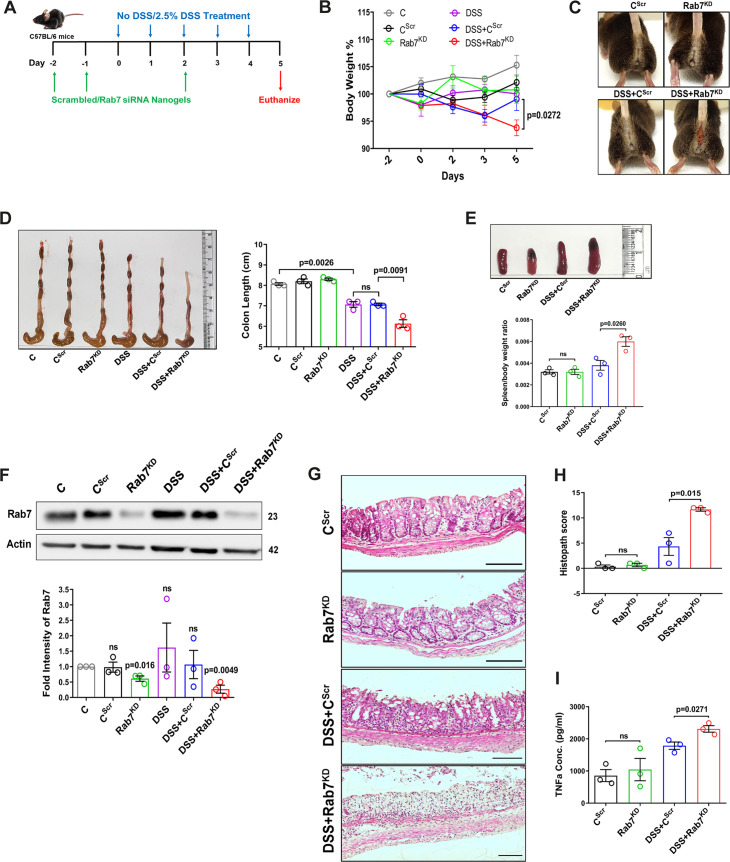
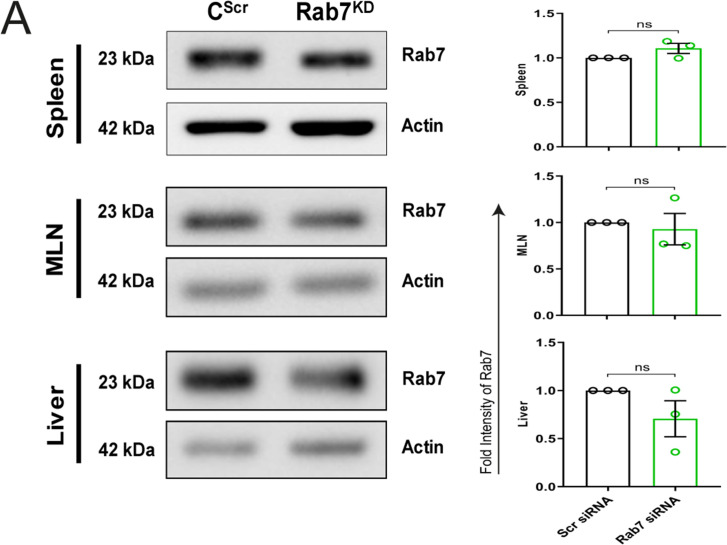
Figure 3. Downregulation of Rab7 aggravates inflammation upon external trigger.
(A) Schematic representation of the experimental plan for knockdown of Rab7 in C57Bl/6 mice showing different treatments (n = 3 mice per group). (B) Graph showing body weight percent. (C) Representative photographs demonstrating rectal bleeding in mice. (D) Gross morphology of colon and caeca. Graph shows colon length quantification. (E) Representative spleens of different treatment mice groups. Graph showing spleen to body weight ratio. (F) Rab7 protein expression in isolated intestinal epithelial cells from mice colon. Graph represents densitometric analysis showing fold intensity of Rab7 expression calculated by normalizing to loading control (β actin). Significance value of each group is relative to the untreated (C) group. (G, H) Hematoxylin and eosin staining of distal colon sections with histopathology scores showing increased characteristics of inflammation. (I) ELISA of TNFα from mucosal extracts of mice colon. Each dot represents one mouse. Error bars represent mean + SEM. Statistical analysis by (B) two-way ANOVA or Student’s t-test. ns = nonsignificant.


