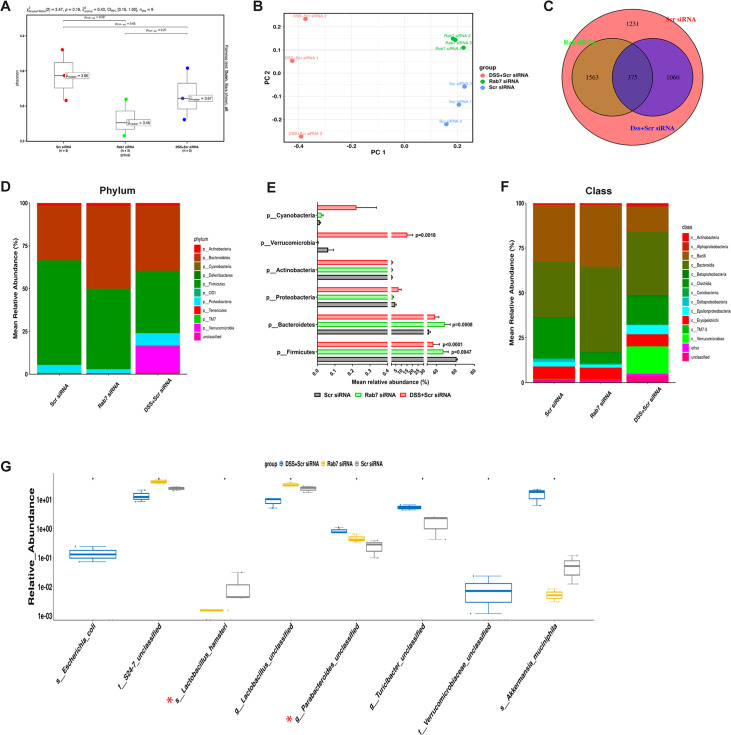
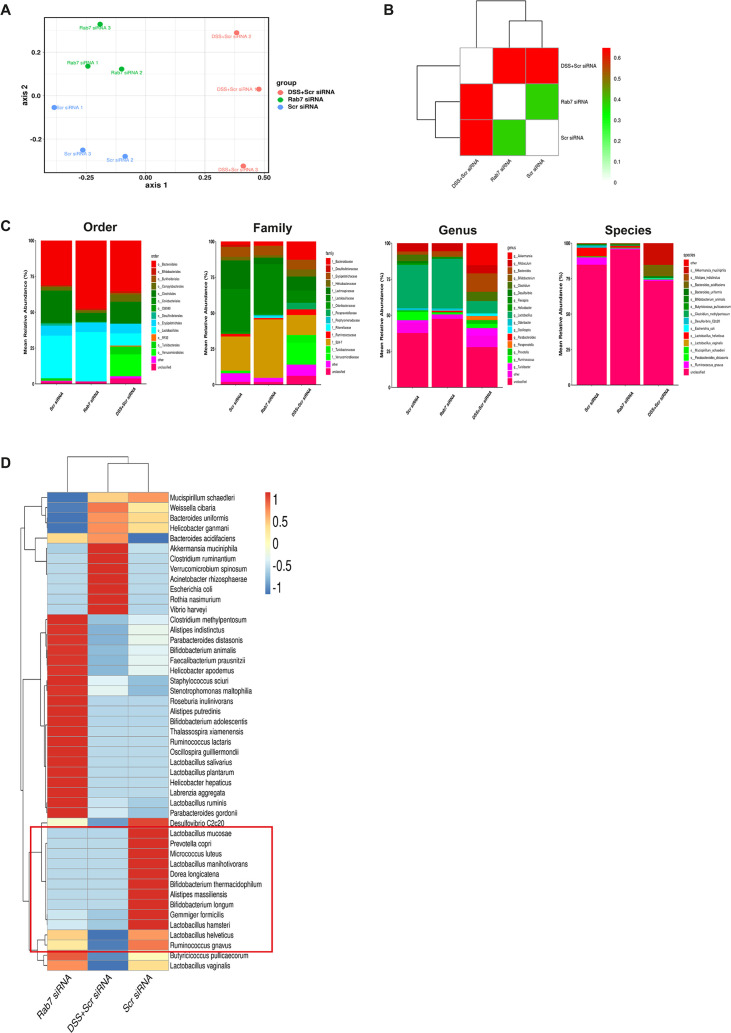
Figure 5. Gut microbiota in Rab7 knockdown mice is altered alike dextran sulfate sodium (DSS)-colitis mice.
Microbial composition of CScr (Scr siRNA), Rab7KD (Rab7 siRNA), and DSS+CScr (DSS+Scr siRNA) was analyzed by 16S metagenomic profiling. (A) Alpha diversity quantified as Shannon index. Significance was calculated using the Kruskal–Wallis test followed by the improved Benjamini–Hochberg procedure from false discovery rate (FDR) correction. (B) Principal coordinates (PCoA) plot calculated from distance matrices obtained from Bray–Curtis. (C) Venn diagram representation of shared and unique operational taxonomic units (OTUs) between groups. (D–F) Mean relative abundance of each taxon. Relative abundance of top 10 phylum (D) and class (F) of each group is depicted in the figure. Each bar represents the mean of the merged OTUs from three mice. Taxonomic lineages not included in top 10 were collapsed as ‘Others’, while the ones which have not been classified has been placed under the category of ‘unclassified’. Relative abundance (in %) of some important taxa showing significant differences between experimental groups (E). (G) Plot showing relative abundance of eight different taxa, identified with Kruskal–Wallis test. Each dot represents one mouse.


