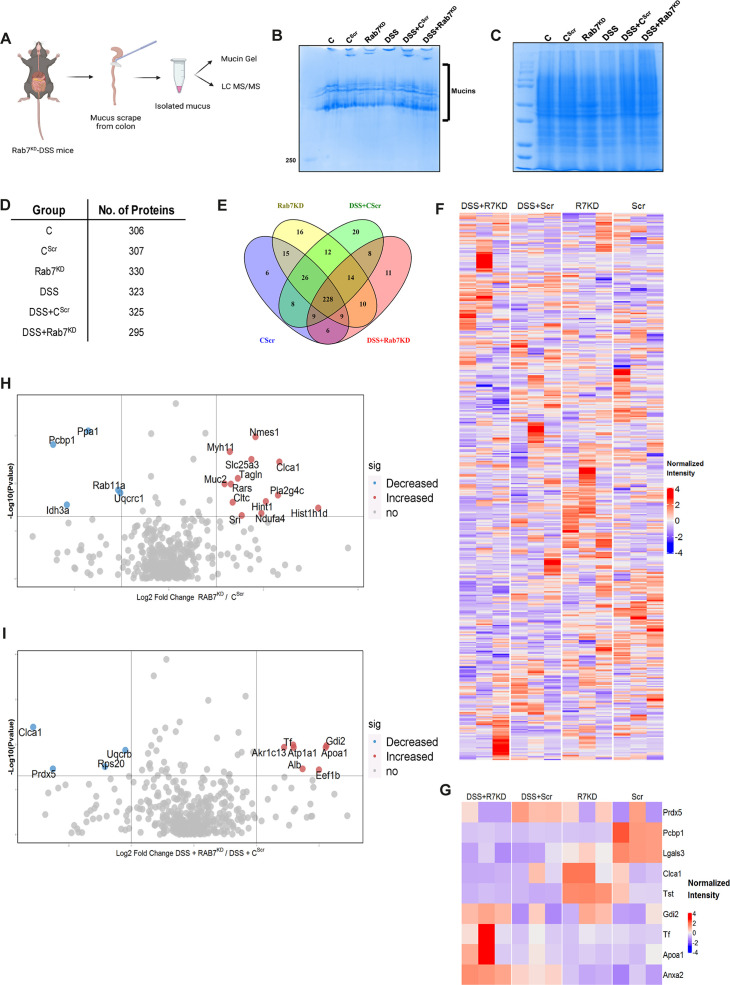
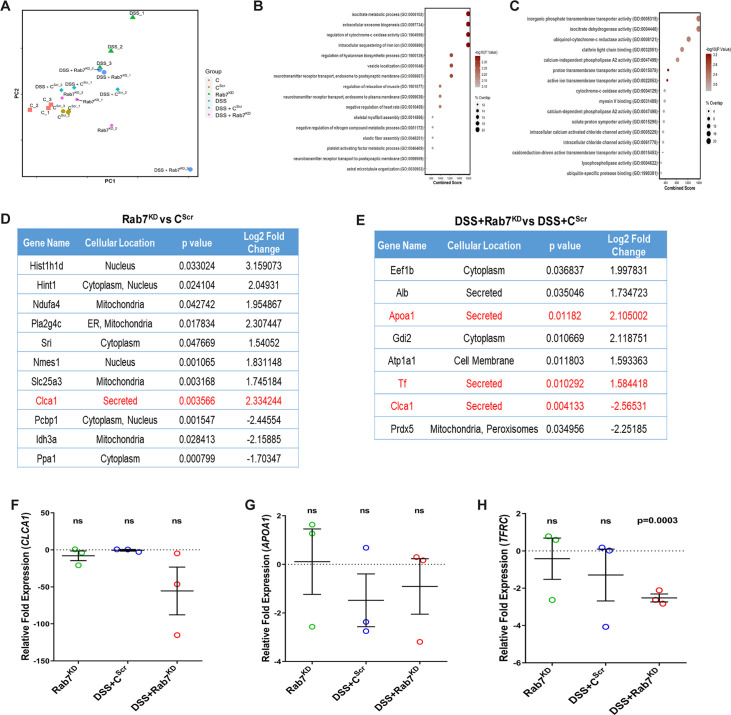
Figure 6. Rab7 perturbation alters mucus composition of colon.
(A) Schematic representing steps for mucus isolation from mice colon followed by sample preparation for total mucin measurement through mucin gels and mucus layer composition analysis using mass spectrometry (Created with BioRender.com and published using a CC BY-NC-ND license with permission). (B) Mucin gel showing the amount of total mucins (blue) stained with Alcian blue dye. (C–E) Coomassie staining of mucus samples isolated from different experimental groups. Table listing the total number of proteins identified in the mucus samples through mass spectrometry and Venn diagram displaying the number of individual proteins common and unique in different samples. (F, G) Heat maps of the proteins differentially expressed without false discovery rate (FDR) (F) and with FDR (G). (H, I) Volcano plots of proteome in mucus samples of different mice groups showing differential expression of proteins in Rab7KD mice versus CScr (H) and DSS+Rab7KD mice versus DSS control group (I).
© 2024, BioRender Inc
Figure 6 was created using BioRender, and is published under a CC BY-NC-ND license. Further reproductions must adhere to the terms of this license.


