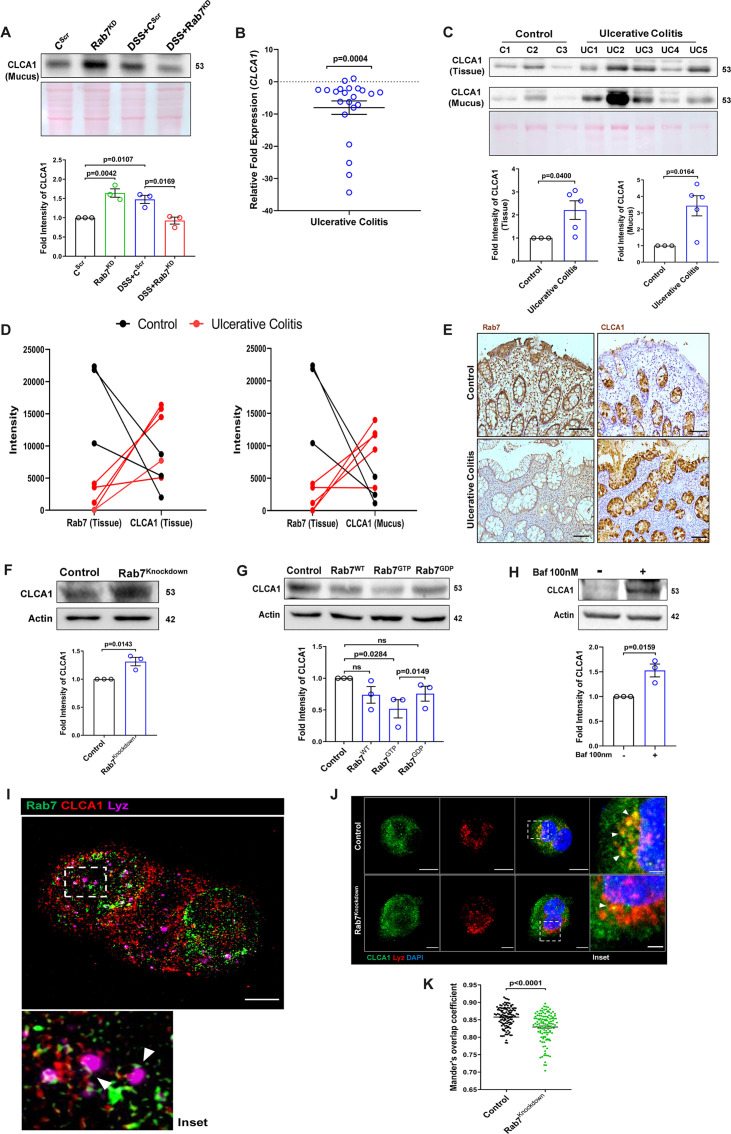
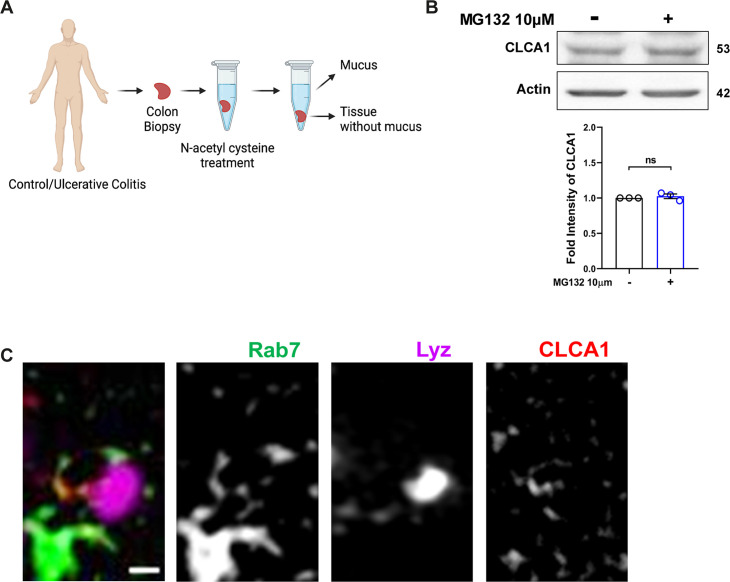
Figure 7. Rab7 mediates CLCA1 degradation via lysosomal pathway in goblet cells.
(A) CLCA1 expression in mucus samples of Rab7KD-DSS mice. Graph represents densitometric analysis showing fold intensity of CLCA1 expression. (B) RT-PCR analysis of relative fold expression of CLCA1 gene in human ulcerative colitis (UC) (n = 22) patient colonic biopsies relative to average control (n = 22) values. HPRT was used for normalization. (C) Immunoblotting of CLCA1 protein in human UC (n = 5) and control (n = 3) mucus and biopsy samples. Graphs represent densitometric analysis showing fold intensity of CLCA1 expression in mucus and tissue samples calculated by normalizing to loading control (GAPDH shown in Figure 1F). (D) Correlation graph showing expression of Rab7 and CLCA1 in mucus and tissue samples of human UC patients relative of controls plotted using fold change from immunoblots. (E) Representative immunohistochemistry images of Rab7 and CLCA1 staining (brown color) in human UC patient (n = 3) and control biopsy (n = 3) sections and cell nuclei (blue color) (scale bar = 100 µm). (F) CLCA1 protein expression in HT29-MTX-E12 cells transfected with either scrambled siRNA (control) or Rab7 siRNA (Rab7Knockdown). Graph represents densitometric analysis showing fold intensity of CLCA1 expression calculated by normalizing to loading control (β actin). (G) Immunoblot showing CLCA1 protein expression change in HT29-MTX-E12 cells overexpressed with EGFP empty vector (control), Rab7-GFP (Rab7WT), Rab7-GFP GTP locked form (Rab7GTP), and Rab7-GFP GDP locked form (Rab7GDP). Graph represents densitometric analysis showing fold intensity of CLCA1 expression calculated by normalizing to loading control (β actin). (H) Immunoblot showing CLCA1 protein expression after treatment of bafilomycin in HT29-MTX-E12 cells. Graph represents densitometric analysis showing fold intensity of CLCA1 expression calculated by normalizing to loading control (β actin). (I) Representative image of structured illumination microscopy showing images of HT29-MTX-E12 cells transfected with Rab7GTP (green) and stained with CLCA1 (red) using anti-CLCA1 antibody and lysosomes with LysoTracker Red DND-99 (magenta) (scale bar = 5 µm). Inset shows zoomed areas of colocalization marked with arrows. (J, K) Representative confocal images of HT29-MTX-E12 cells transfected with either scrambled siRNA (control) or Rab7 siRNA (Rab7Knockdown). Cells are stained with CLCA1 (green) using anti-CLCA1 antibody and lysosomes with LysoTracker Red DND-99 (red). Graph shows quantitation of colocalization between CLCA1 and lysosomes from images (n = 120) using Mander’s overlap coefficient (scale bar = 100 µm). Inset shows zoomed areas of the image with colocalization puncta (yellow) marked with arrows (scale bar = 50 µm). Each dot represents (A) one mouse or (B, C, E) one human or (F–H) one independent experiment. Error bars represent mean + SEM. Statistical analysis by (C) Welch’s t-test or (A, B, F–H, K) Student’s t-test. ns = nonsignificant.


