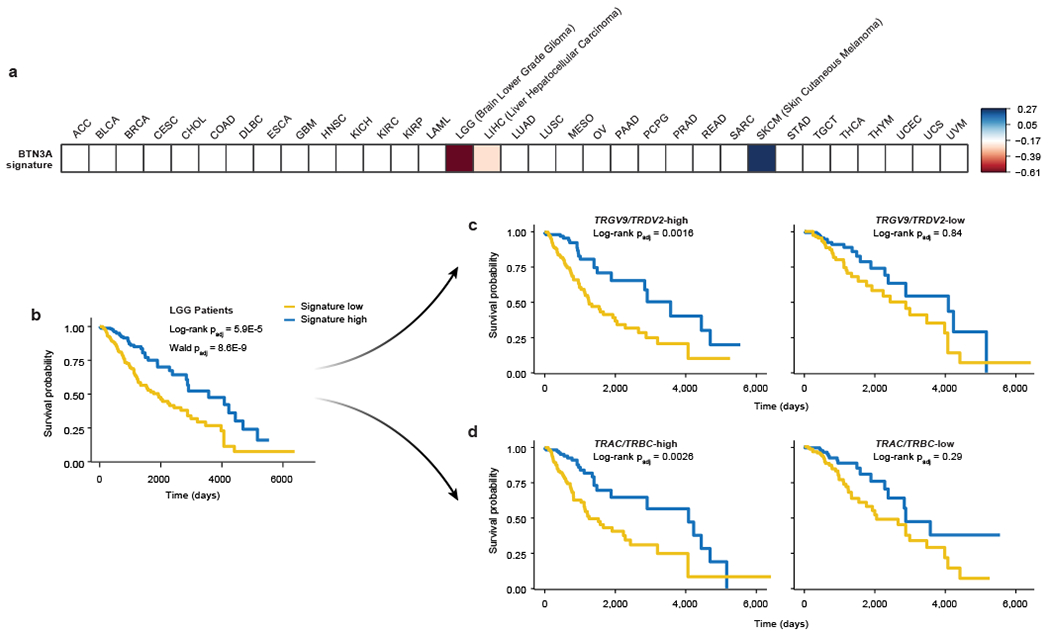
Extended Data Figure 6. BTN3A expression screen gene signature.

(a) Heatmap of the hazard ratios (natural log-transformed) associated with the BTN3A screen gene signature in TCGA patients for 33 cancer types (a positive log-ratio indicates a worse prognosis and a negative one indicates a protective effect of the gene signature). The BTN3A screen gene signature was scaled to mean=0, SD=1. Values shown only for cancer types with significant survival and signature association in patient tumours, as determined by a Wald test with Benjamini-Hochberg multiple comparisons correction (two-sided padj < 0.05). (b-d) Survival of (b) total, (c) TRGV9/TRDV2-high/low, or (d) TRAC/TRBC-high/low LGG patients split by high and low expression of the BTN3A expression screen gene signature. Log-rank test (Kaplan-Meier survival analysis) and Wald test (Cox regression), adjusted (padj) with Benjamini-Hochberg multiple comparisons correction.
