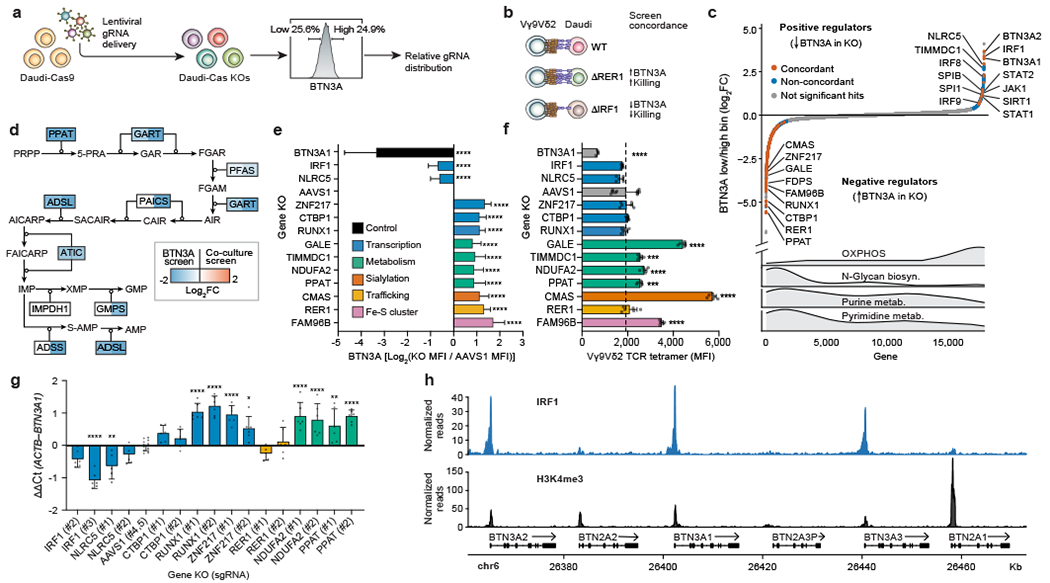
Figure 2. Systematic discovery of BTN3A surface expression regulators.

(a) Genome-wide KO screen for surface expression of BTN3A. Top and bottom 25% based on BTN3A surface staining were sorted for downstream analysis. (b) Screen concordance with examples of hits concordant between the two screens. (c) All 18,010 genes ranked from negative to positive enrichment of Daudi-Cas9 KOs in BTN3Alow relative to BTN3Ahigh cells. Concordant and non-concordant hits highlighted (BTN3A screen FDR<0.01, co-culture screen FDR<0.05). Distribution of selected KEGG gene sets shown below. (d) Depletion of purine biosynthesis pathway KOs across both screens. Shading indicating log2FC shown only for significant hits (FDR<0.05). (e) Surface BTN3A median fluorescence intensity (MFI) at 13 days post-transduction, normalized to BTN3A MFI in AAVS1 controls and log2-transformed. Two distinct KOs per gene deletion, except BTN3A1 (one KO). Combined data from three separate experiments, each individually normalized. AAVS1 n=36, BTN3A1 n=9, all other deletions n=18. (f) Vγ9Vδ2 TCR tetramer staining fluorescence (MFI) at 13 days post-transduction. Data from one experiment. AAVS1 n=12, BTN3A1 n=3, all other deletions n=6. (g) qPCR data for BTN3A1 transcripts normalized to ACTB transcripts. n=5-6, AAVS1 n=12, data combined from two independent experiments. (h) CUT&RUN data for IRF1 binding and H3K4me3 chromatin modification at the butyrophilin locus. n=3 per condition. (e-g) One-way ANOVA with Dunnett’s multiple comparisons test. Mean ± SD. p<0.0001 (****), p<0.001 (***), p<0.01 (**), p<0.05 (*).
