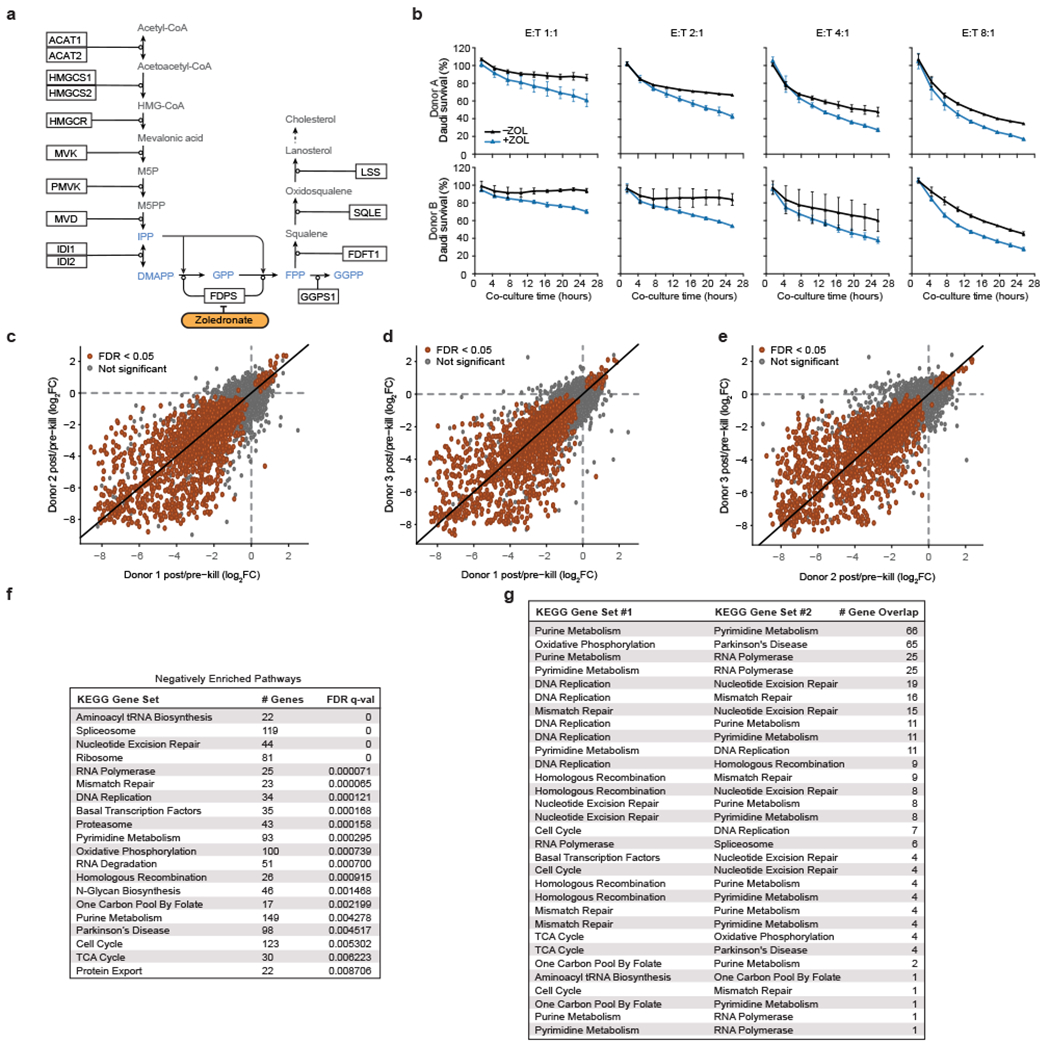
Extended Data Figure 1. Mevalonate pathway effects, co-culture screen consistency, and gene set enrichment analysis (GSEA).

(a) Schematic of the mevalonate pathway, adapted from WikiPathways. Phosphoantigens highlighted in blue. (b) Survival of eGFP+ Daudi cells co-cultured with primary Vγ9Vδ2 T cells at different effector-to-target (E:T) ratios with or without zoledronate (ZOL). Cells were quantified using real-time quantitative live-cell imaging (Incucyte). Survival was normalized to Daudi cells cultured without T cells. Mean ± SD. n=3 per condition. (c-e) Pairwise comparisons of log2(fold change [FC]) of screen results among the three healthy human PBMC donors. (f) Number of genes contained within each negatively enriched KEGG gene set after filtering out genes that were not in the screen dataset, FDR q-values, and (g) number of genes found in two KEGG gene sets.
