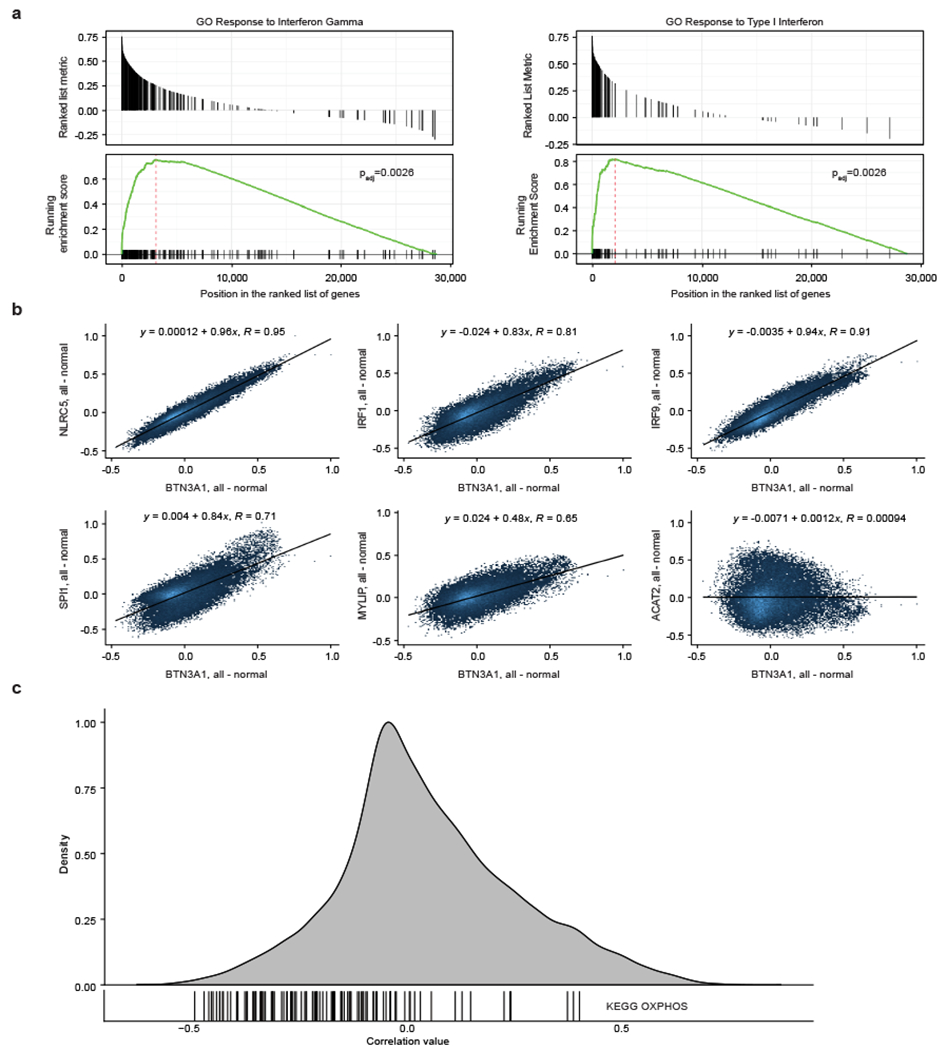
Extended Data Figure 3. Correlation of expression between BTN3A1 and screen hits across thousands of samples.

(a) BTN3A1 expression correlation with gene ontology (GO) pathways across thousands of healthy samples (all tissues combined) collated by Correlation AnalyzeR. To determine pathways that correlate with BTN3A1, genome-wide Pearson correlations for BTN3A1 are used as a ranking metric in the GSEA algorithm, which determines the padj-value. (b) Pairwise correlations between expression of BTN3A1 and shown genes across thousands of healthy samples (all tissues combined) (Correlation AnalyzeR). (c) Each vertical line indicates the correlation between expression of BTN3A1 and one of the genes in the KEGG oxidative phosphorylation (OXPHOS) gene set, overlaid over a density plot of the BTN3A1 pairwise correlations with genes across the entire human genome. Data from healthy immune tissues (Correlation AnalyzeR).
