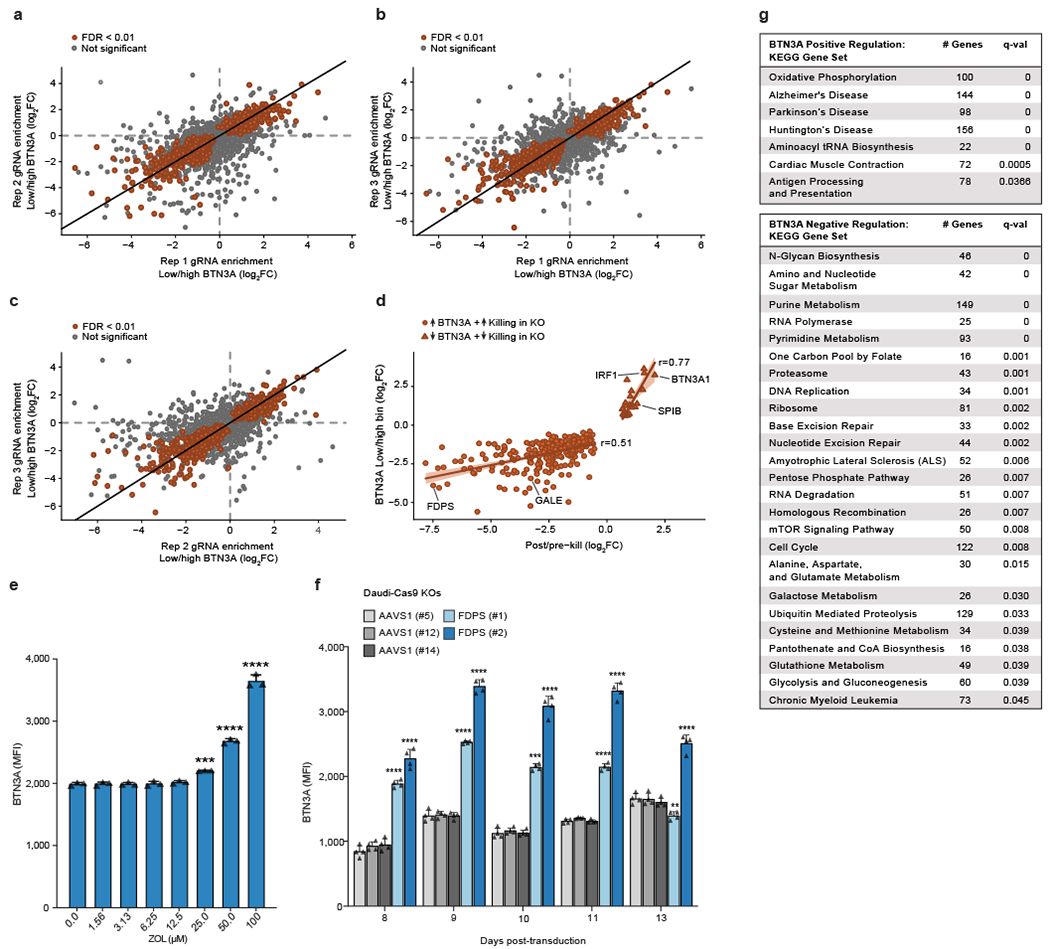
Extended Data Figure 4. BTN3A expression screen consistency, cross-screen correlation, FDPS validation, and GSEA.

(a-c) Pairwise comparisons of significant (FDR<0.01) and not significant results among the three replicates (Rep) of Daudi-Cas9 cell populations used for the BTN3A expression screen. (d) Correlation of screen effect sizes (LFC) among concordant hits separated into positive and negative regulators of BTN3A surface expression. Linear regression line with a 95% confidence interval is shown. (e) Surface BTN3A staining on live Daudi-Cas9 cells treated for 72 hours with zoledronate (ZOL), an inhibitor of FDPS. n=3 per ZOL dose, representative data from one of three independent experiments. One-way ANOVA comparison to no treatment with Dunnett’s multiple comparisons test. (f) Surface BTN3A staining on live Daudi-Cas9 FDPS KO or control AAVS1 KO cells at indicated days after lentiviral sgRNA transduction. n=4 for each KO. One-way ANOVA comparison to Daudi-Cas9 AAVS1 (#5) KO cells with Dunnett’s multiple comparisons test. (e, f) Mean ± SD. p<0.0001 (****), p<0.001 (***), p<0.01 (**). (g) GSEA of KEGG gene sets that positively or negatively regulate surface BTN3A expression. Number of genes contained within each KEGG gene set after filtering out genes that were not in the screen dataset and FDR q-values are shown.
