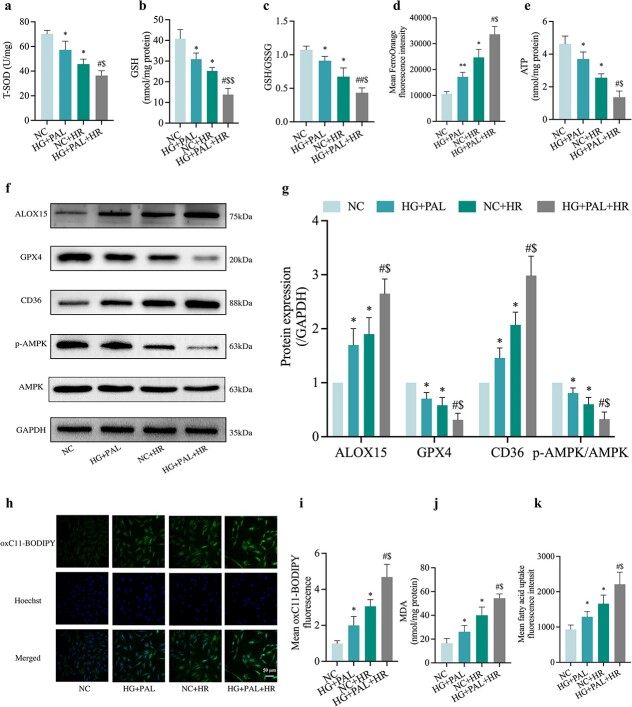
Figure 6.
Oxidative stress and ferroptosis in HR-treated H9c2 cardiomyocytes with changes in the expression of AMPK and CD36. (a) Level of T-SOD. (b,c) Alterations of GSH and GSH/GSSG levels. (d) FerroOrange fluorescence intensity. (e) ATP content. (f) Representative images of protein expression. (g) ALOX15, GPX4, CD36 and p-AMPK/AMPK protein expression. (h) Lipid peroxidation measured by C11 BODIPY (Scale bar: 50 μm). (i) Statistical graph of C11 BODIPY. (j) Degree of MDA. (k) FA uptake assay. Data are expressed as the mean ± SD from three independent experiments each performed in triplicate. *p < 0.05 vs NC group, #p < 0.05 vs HG + PAL group, $p < 0.05 vs NC + HR group, **p < 0.01 vs NC group, ##p < 0.01 vs HG + PAL group. NC normal control, HG high glucose, PAL palmitic acid, HR hypoxia/reoxygenation, T-SOD total-superoxide dismutase, GSH L-glutathione, GSSG oxidized L-glutathione, ALOX15 arachidonate-15-lipoxygenase, GPX4 glutathione peroxidase 4, CD36 cluster of differentiation 36, AMPK adenosine 5‘-monophosphate-activated protein kinase, p-AMPK phosphorylated AMPK, MDA malonaldehyde, ATP adenosine-triphosphate

