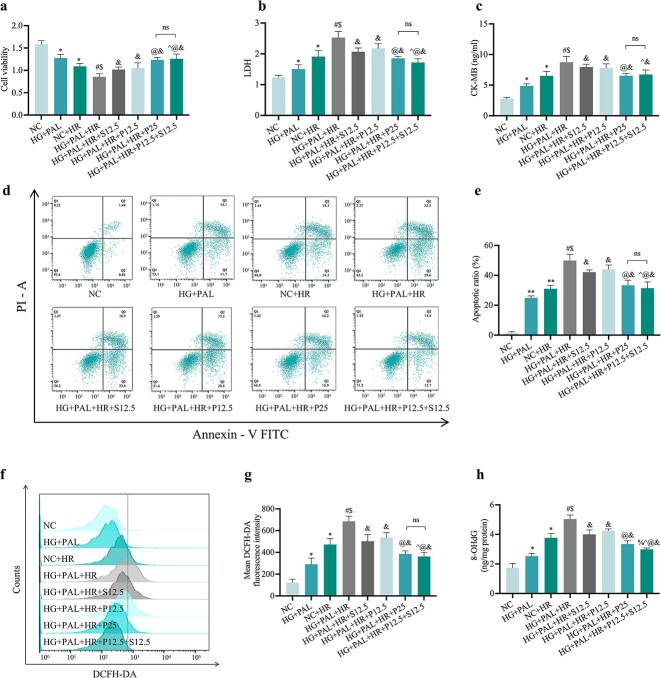
Figure 8.
Propofol and/or SAA reduced H9c2 cells HR injury under HG and PAL. (a) Cell viability. (b) Leakage of LDH. (c) Concentration of CK-MB. (d) Counts of apoptotic cells by flow cytometry. (e) Quantification of apoptotic ratio. (f) ROS levels detected by DCFH-DA fluorescence flow cytometry. (g) Statistical image of mean DCFH-DA fluorescence intensity. (h) Extent of 8-OHdG. Data are expressed as the mean ± SD from three independent experiments each performed in triplicate. *p < 0.05 vs NC group, #p < 0.05 vs HG + PAL group, $p < 0.05 vs NC + HR group, &p < 0.05 vs HG + PAL + HR group, ^p < 0.05 vs HG + PAL + HR + S12.5 group, @p < 0.05 vs HG + PAL + HR + P12.5 group, %p < 0.05 vs HG + PAL + HR + P25 group, ns not significant. NC normal control, HG high glucose, PAL palmitic acid, HR hypoxia/reoxygenation, P propofol, S salvianolic acid A, LDH lactate dehydrogenase, CK-MB cardiac-type creatine kinase isoenzyme, 8-OHdG 8-hydroxy-2′-deoxyguanosine

