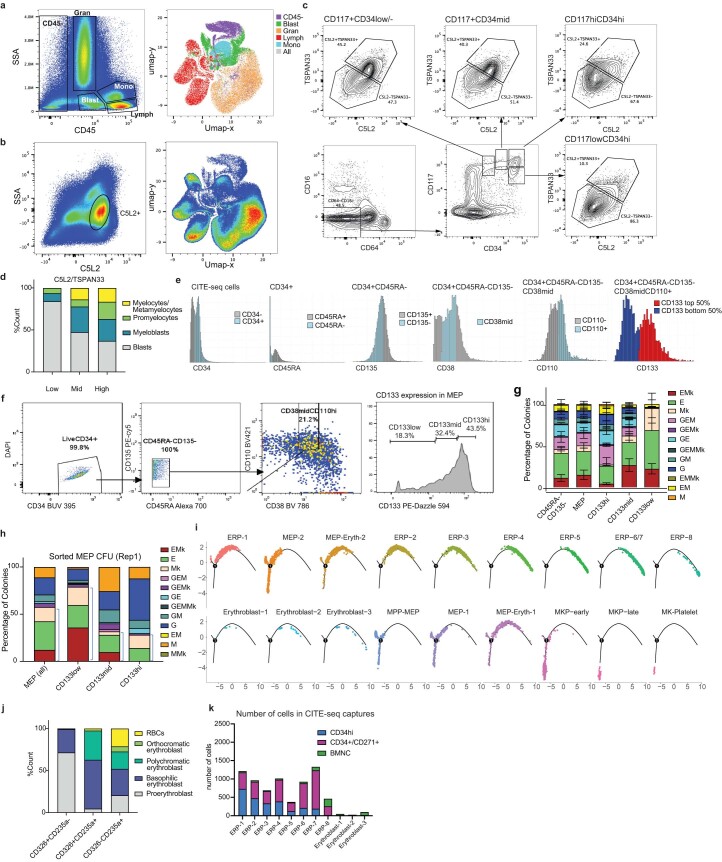
Extended Data Fig. 9. Validation of transitional cell states.
a, Cells in a commonly used clinical diagnostic gate (CD45/SSA) and their presentation on UMAP. b, C5L2 + cells visualized on UMAP. c, CD34+/dim CD117+ cells examined for C5L2 and TSPAN33 expression. d, Cell count by morphology of C5L2/TSPAN33 Low/Mid/High sorted cells. e, Virtually gated ‘MEP’ in CITE-seq data. f, Sorting gate setup in CD133 index sorting. g, CFU readout of indexed sorted cells grouped by CD133 expression. Error bar shows Mean with SD. h, CFU readout of MEP cells sorted based CD133 expression from the other donor. i, Monocle trajectory analysis of erythroid progenitor hierarchy. j. Cell count by morphology in CD326+, CD326 + CD235a+ and CD235a+ sorted cells. k, Number of erythroid progenitors from each CITE-seq capture. Morphology cell counts are based on 10 high-power fields. CFU assays are results of three replicates from two donors either combined (g) or displayed individually (h).

